. 2014 Sep 5;9(9):e106524.
doi: 10.1371/journal.pone.0106524. eCollection 2014.

Discovering study-specific gene regulatory networks

Affiliations

Discovering study-specific gene regulatory networks

Valeria Bo et al. PLoS One. .

Abstract

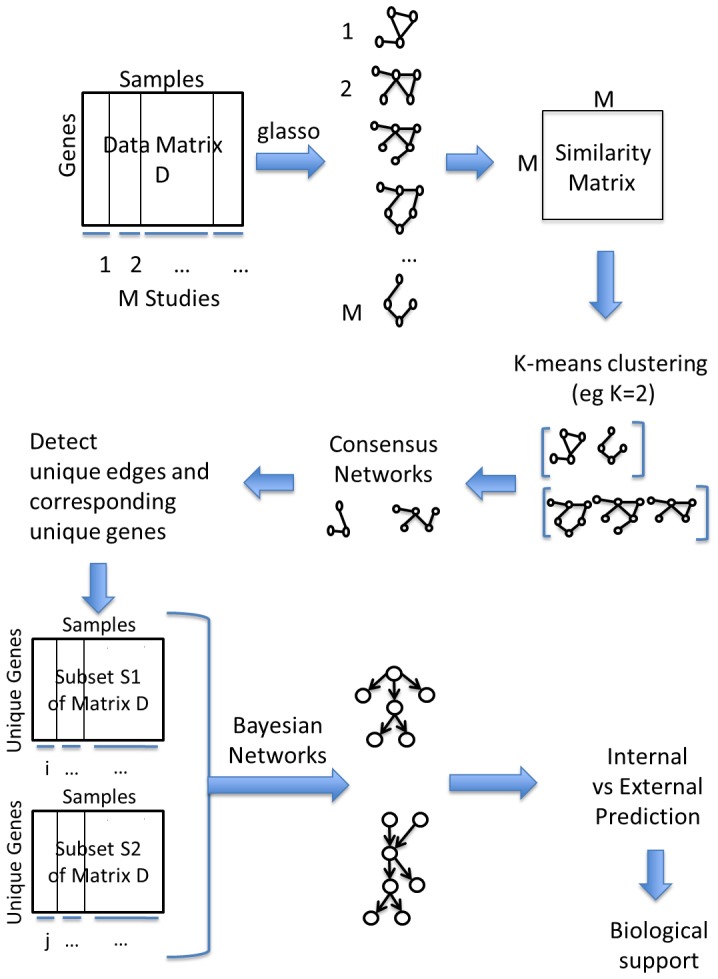
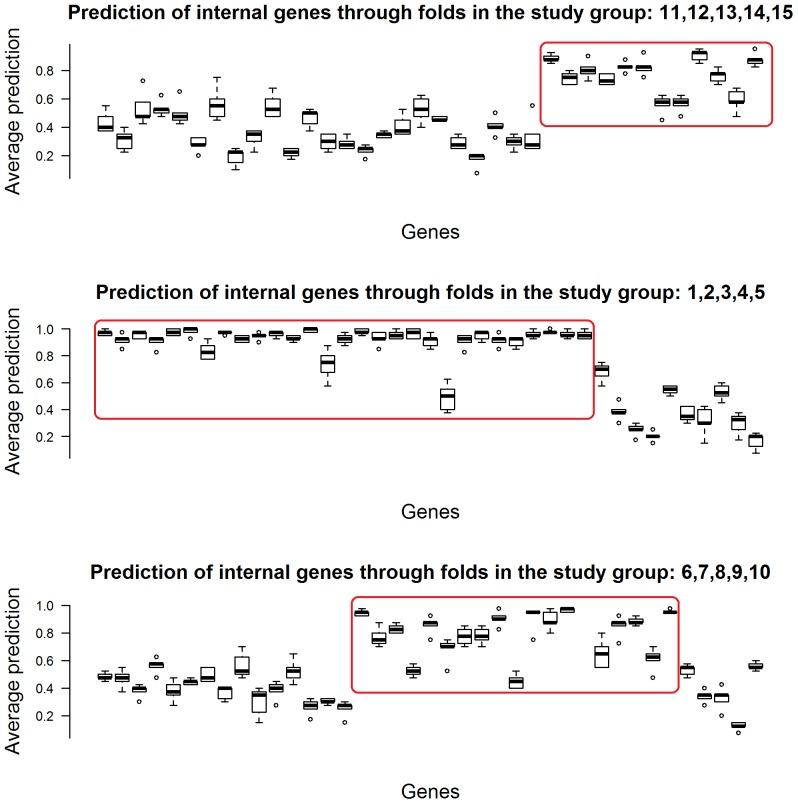
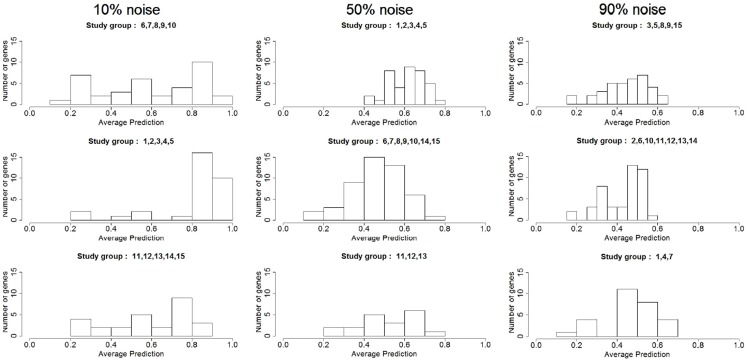
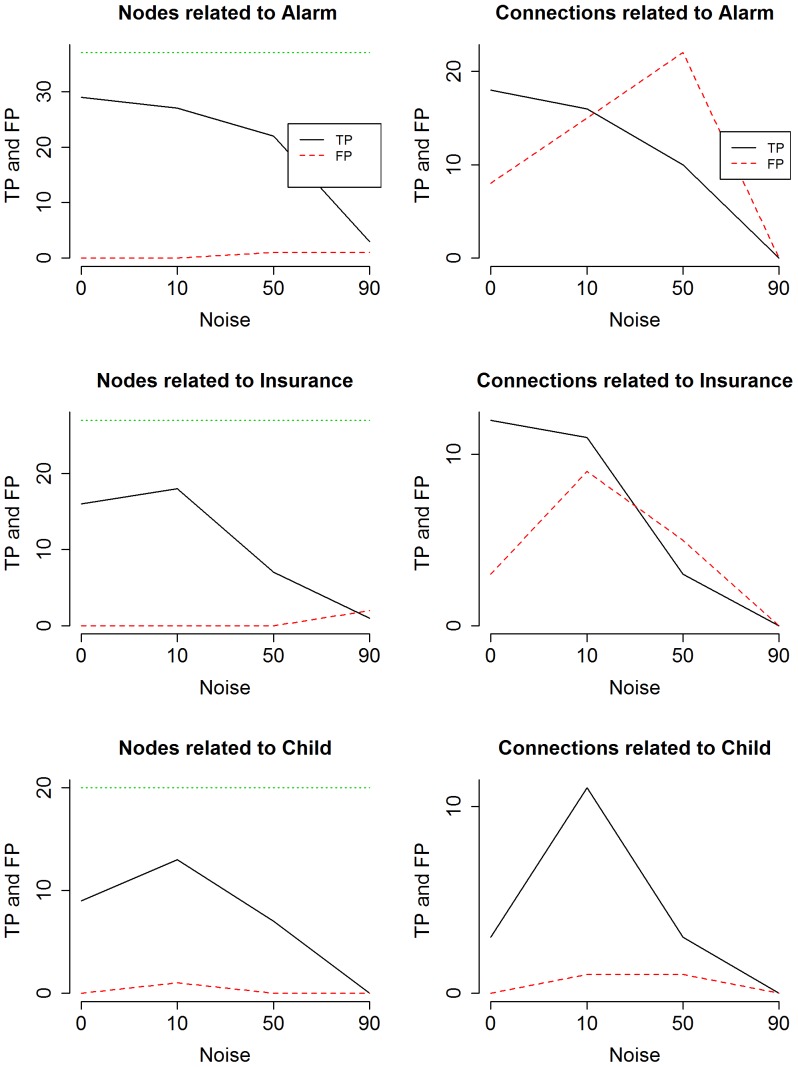
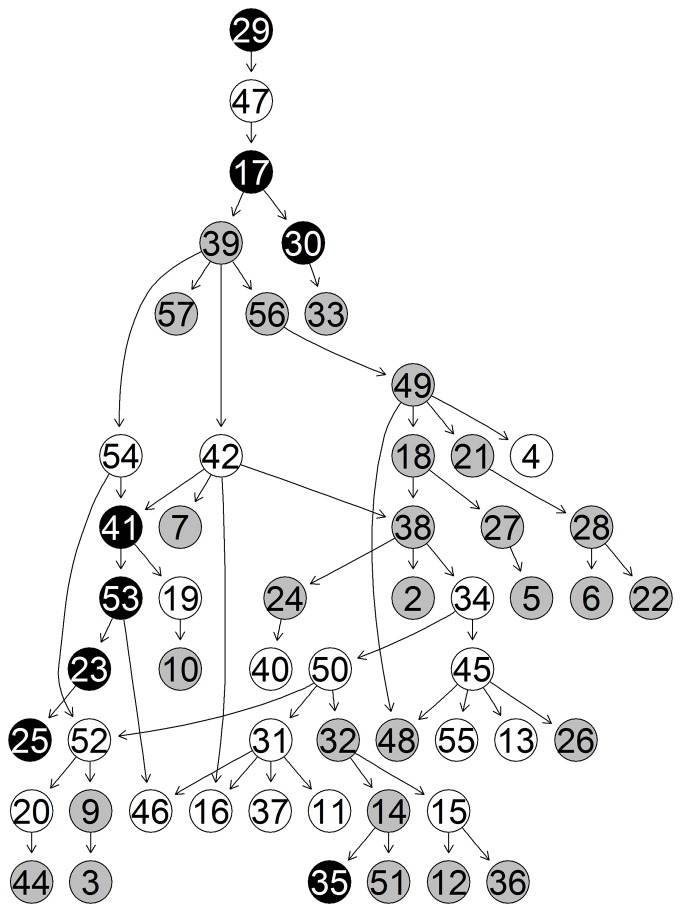
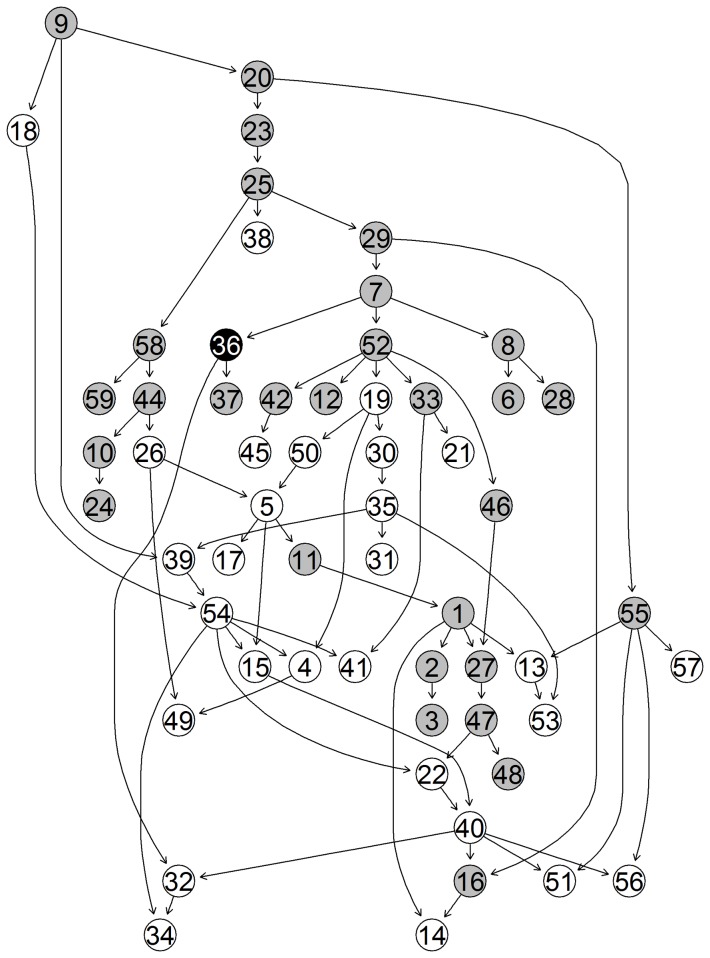
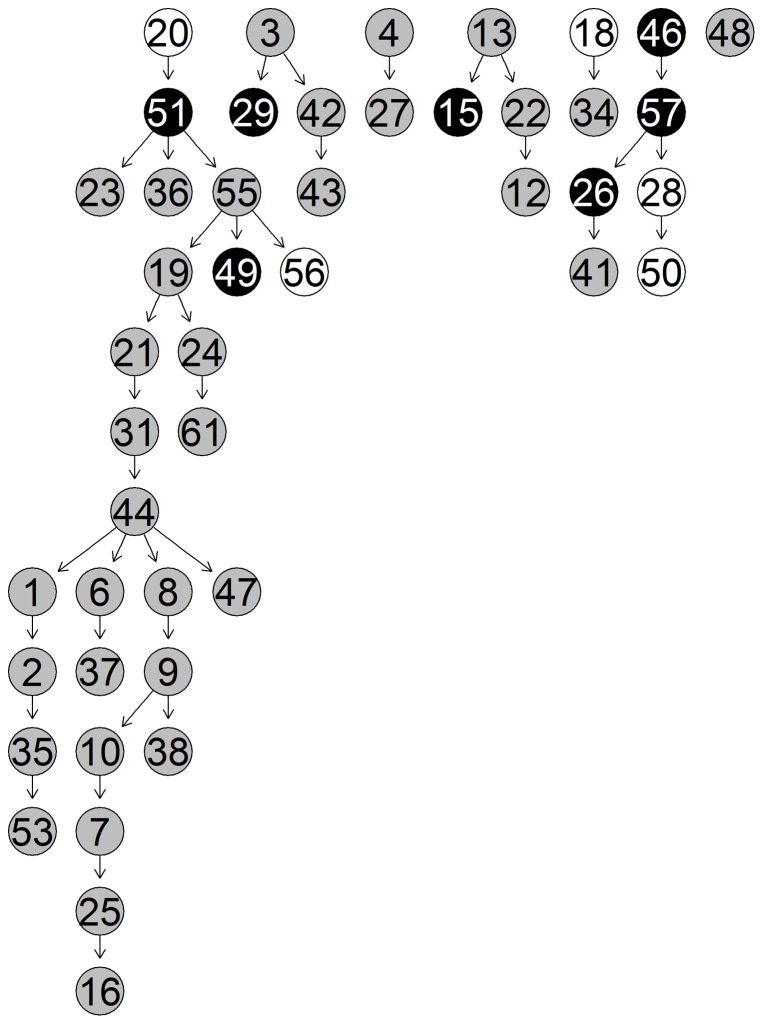
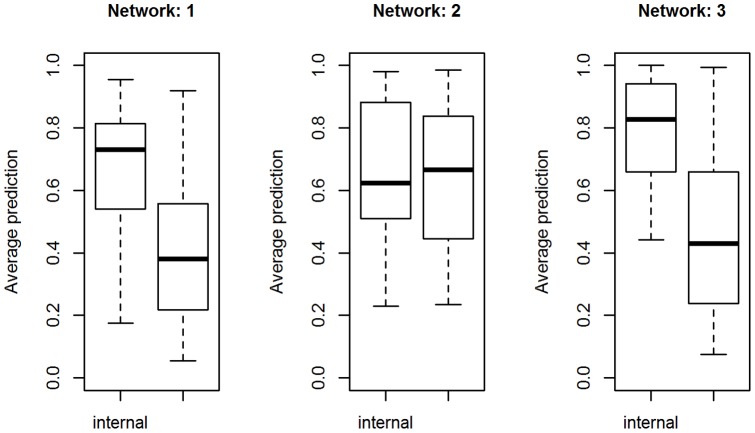
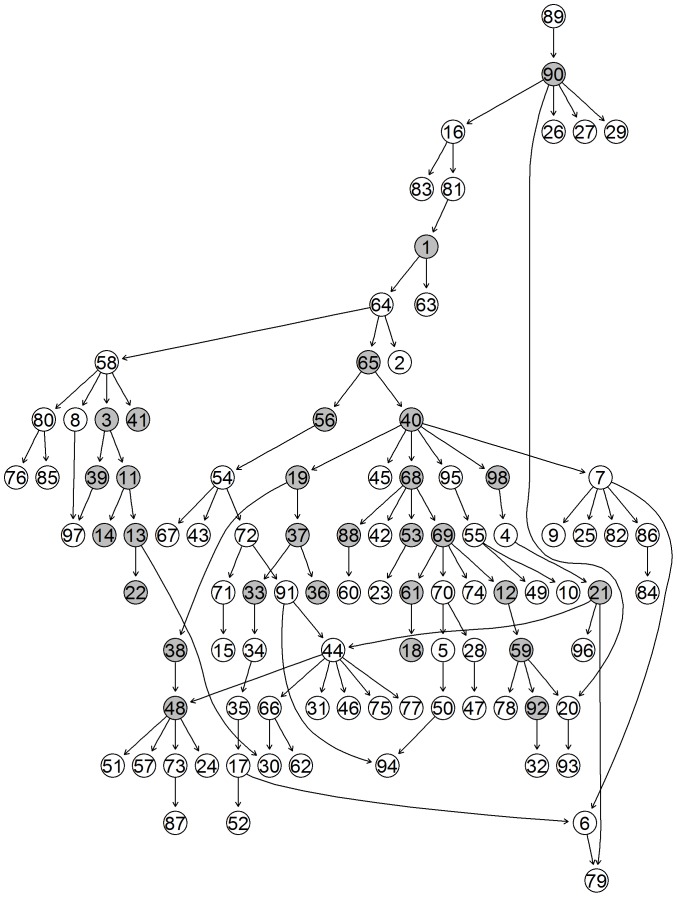
Microarrays are commonly used in biology because of their ability to simultaneously measure thousands of genes under different conditions. Due to their structure, typically containing a high amount of variables but far fewer samples, scalable network analysis techniques are often employed. In particular, consensus approaches have been recently used that combine multiple microarray studies in order to find networks that are more robust. The purpose of this paper, however, is to combine multiple microarray studies to automatically identify subnetworks that are distinctive to specific experimental conditions rather than common to them all. To better understand key regulatory mechanisms and how they change under different conditions, we derive unique networks from multiple independent networks built using glasso which goes beyond standard correlations. This involves calculating cluster prediction accuracies to detect the most predictive genes for a specific set of conditions. We differentiate between accuracies calculated using cross-validation within a selected cluster of studies (the intra prediction accuracy) and those calculated on a set of independent studies belonging to different study clusters (inter prediction accuracy). Finally, we compare our method's results to related state-of-the art techniques. We explore how the proposed pipeline performs on both synthetic data and real data (wheat and Fusarium). Our results show that subnetworks can be identified reliably that are specific to subsets of studies and that these networks reflect key mechanisms that are fundamental to the experimental conditions in each of those subsets.


Conflict of interest statement

Competing Interests: The authors have declared that no competing interests exist.

Figures

Figure 1
Figure 1. Flowchart of the steps for the pipeline.
The figure shows the main steps that constitute the pipeline. Each step is properly described in this section.
Figure 2
Figure 2. Pipeline overview.
A schematic overview of the sequence of steps forming the pipeline.
Figure 3
Figure 3. Big matrix constructed from the datasets generated from the three networks and six randomly generated datasets which represent the noise.
The shaded regions indicate the non-noisy datasets generated from Alarm, Insurance and Child networks (respectively A, I and C in the figure).
Figure 4
Figure 4. Study-clusters for the original data (0% of noise), 10%, 50% and 90% of noise.
The studies' number highlighted with the same colour belong to the same cluster.
Figure 5
Figure 5. TPs and FPs vs noise before calculating the correct-prediction.
The figures show the evolution of TPs and FPs vs noise in terms of nodes (variables involved in the discovered subnetworks) and connections between nodes. These are the partial results, prior to the filtering of the informative nodes based on the intra cluster correct-prediction accuracy (which are shown in Figure 6).
Figure 6
Figure 6. Intra cluster correct-prediction for simulated data.
The figure shows the boxplots of the intra cluster correct-prediction (calculated within the same cluster using cross-validation) for the simulated dataset in the case of 0% of noise.
Figure 7
Figure 7. Intra cluster correct-prediction distribution for 10, 50 and 90% perturbation.
The figures show the histograms of the intra cluster correct-prediction (calculated within the same cluster using cross-validation) for the simulated dataset for different levels of noise.
Figure 8
Figure 8. TPs and FPs vs noise after calculating correct-prediction.
The graphs show the number of TPs and FPs nodes and connections detected at different levels of noise. Threshold set to 0.6. The dotted lines at the top of the graphs indicates the number of nodes in the relative original network.
Figure 9
Figure 9. Network 1.
Unique-Network for wheat under stress-enriched conditions in cluster 1. Grey nodes indicate highly predictive (average correct-prediction level higher or equal to 0.6) genes. Black nodes highlight highly predictive and stress related genes.
Figure 10
Figure 10. Network 2.
Unique-Network for wheat under stress-enriched conditions in cluster 2. Grey nodes indicate highly predictive (average correct-prediction level higher or equal to 0.6) genes. Black nodes highlight highly predictive and stress related genes.
Figure 11
Figure 11. Network 3.
Unique-Network for wheat under non-stress conditions in cluster 3.Grey nodes indicate highly predictive (average correct-prediction level higher or equal to 0.6) genes. Black nodes highlight highly predictive and stress related genes.
Figure 12
Figure 12. Boxplot intra vs inter clusters correct-prediction.
Figure 13
Figure 13. Unique-Network for Fusarium cluster 2,5,6,7,13.
In this figure grey background indicates highly predictive genes (average correct-prediction equal or higher than 0.6). Despite the lack of different conditions in the dataset, as explained in the text, still about a 1/3 of the genes selected are highly predictive.
Figure 14
Figure 14. Intra vs inter clusters prediction for Fusarium.

References

    1. Swift S, Tucker A, Vinciotti V, Martin N, Orengo C, et al. (2004) Consensus clustering and functional interpretation of gene-expression data. Genome biology 5: R94. - PMC - PubMed
    1. Bo V, Lysenko A, Saqi M, Habash D, Tucker A (2013) Integrating multiple studies of wheat microarray data to identify treatment-specific regulatory networks. In: Advances in Intelligent Data Analysis XII, Springer. pp. 104–115.
    1. Choi J, Yu U, Kim S, Yoo O (2003) Combining multiple microarray studies and modeling interstudy variation. Bioinformatics 19: i84–i90. - PubMed
    1. Kirk P, Griffin JE, Savage RS, Ghahramani Z, Wild DL (2012) Bayesian correlated clustering to integrate multiple datasets. Bioinformatics 28: 3290–3297. - PMC - PubMed
    1. Anvar S, Tucker A, et al. (2010) The identification of informative genes from multiple datasets with increasing complexity. BMC bioinformatics 11: 32. - PMC - PubMed

LinkOut - more resources