

Genetic bottlenecks in time and space: reconstructing invasions from contemporary and historical collections
- PMID: 25192006
- PMCID: PMC4156389
- DOI: 10.1371/journal.pone.0106874
Genetic bottlenecks in time and space: reconstructing invasions from contemporary and historical collections
Abstract
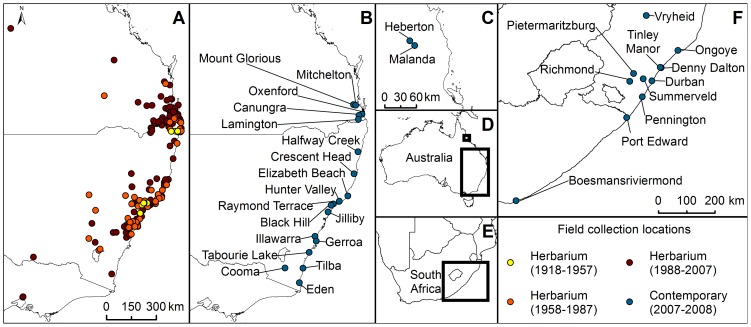
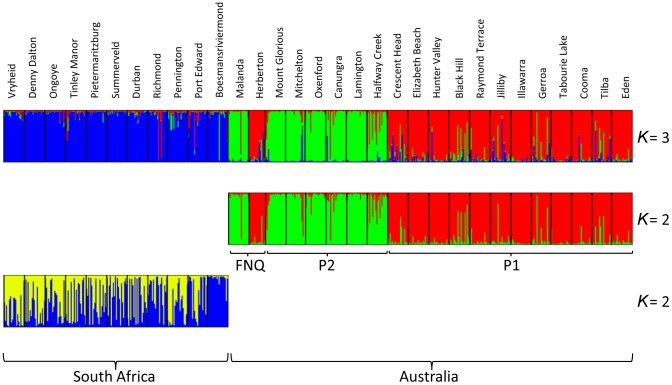
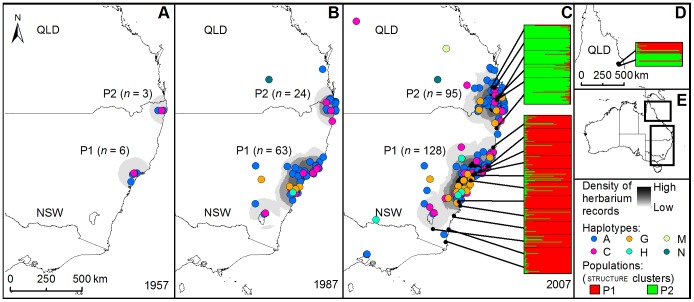
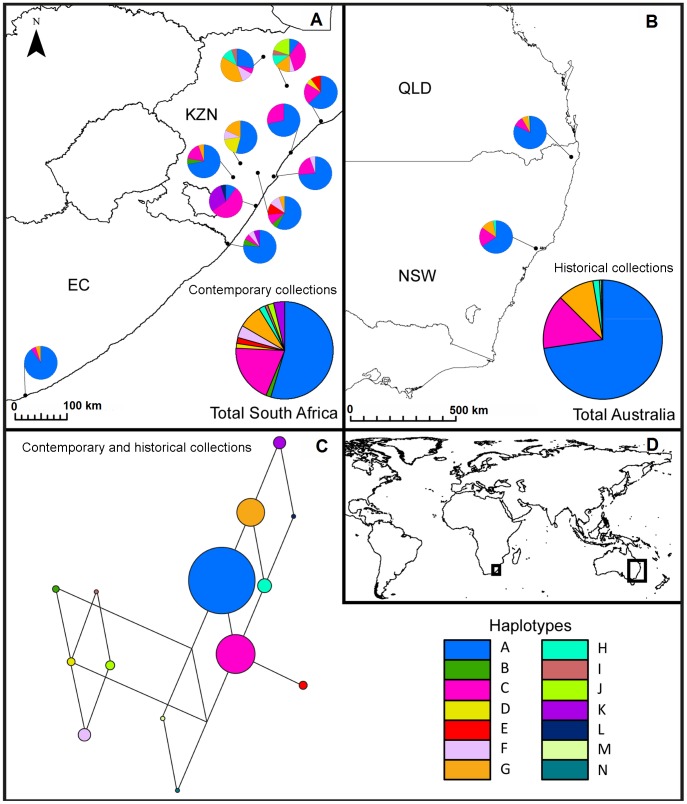
Herbarium accession data offer a useful historical botanical perspective and have been used to track the spread of plant invasions through time and space. Nevertheless, few studies have utilised this resource for genetic analysis to reconstruct a more complete picture of historical invasion dynamics, including the occurrence of separate introduction events. In this study, we combined nuclear and chloroplast microsatellite analyses of contemporary and historical collections of Senecio madagascariensis, a globally invasive weed first introduced to Australia c. 1918 from its native South Africa. Analysis of nuclear microsatellites, together with temporal spread data and simulations of herbarium voucher sampling, revealed distinct introductions to south-eastern Australia and mid-eastern Australia. Genetic diversity of the south-eastern invasive population was lower than in the native range, but higher than in the mid-eastern invasion. In the invasive range, despite its low resolution, our chloroplast microsatellite data revealed the occurrence of new haplotypes over time, probably as the result of subsequent introduction(s) to Australia from the native range during the latter half of the 20th century. Our work demonstrates how molecular studies of contemporary and historical field collections can be combined to reconstruct a more complete picture of the invasion history of introduced taxa. Further, our study indicates that a survey of contemporary samples only (as undertaken for the majority of invasive species studies) would be insufficient to identify potential source populations and occurrence of multiple introductions.
Conflict of interest statement
Figures
Similar articles
-
The making of a rapid plant invader: genetic diversity and differentiation in the native and invaded range of Senecio inaequidens.Mol Ecol. 2010 Sep;19(18):3952-67. doi: 10.1111/j.1365-294X.2010.04797.x. Epub 2010 Aug 31. Mol Ecol. 2010. PMID: 20854275
-
Cultivation shapes genetic novelty in a globally important invader.Mol Ecol. 2012 Jul;21(13):3187-99. doi: 10.1111/j.1365-294X.2012.05601.x. Epub 2012 May 14. Mol Ecol. 2012. PMID: 22582829
-
Bayesian inference of a complex invasion history revealed by nuclear and chloroplast genetic diversity in the colonizing plant, Silene latifolia.Mol Ecol. 2012 Oct;21(19):4721-34. doi: 10.1111/j.1365-294X.2012.05751.x. Epub 2012 Sep 3. Mol Ecol. 2012. PMID: 22943057
-
What do we really know about alien plant invasion? A review of the invasion mechanism of one of the world's worst weeds.Planta. 2016 Jul;244(1):39-57. doi: 10.1007/s00425-016-2510-x. Epub 2016 Apr 7. Planta. 2016. PMID: 27056056 Review.
-
Genetic reconstructions of invasion history.Mol Ecol. 2015 May;24(9):2212-25. doi: 10.1111/mec.13117. Epub 2015 Mar 25. Mol Ecol. 2015. PMID: 25703061 Review.
Cited by
-
Occasional hybridization between a native and invasive Senecio species in Australia is unlikely to contribute to invasive success.PeerJ. 2017 Aug 15;5:e3630. doi: 10.7717/peerj.3630. eCollection 2017. PeerJ. 2017. PMID: 28828245 Free PMC article.
-
The Australasian Virtual Herbarium: Tracking data usage and benefits for biological collections.Appl Plant Sci. 2018 Mar 2;6(2):e1026. doi: 10.1002/aps3.1026. eCollection 2018 Feb. Appl Plant Sci. 2018. PMID: 29732257 Free PMC article.
-
Travel Tales of a Worldwide Weed: Genomic Signatures of Plantago major L. Reveal Distinct Genotypic Groups With Links to Colonial Trade Routes.Front Plant Sci. 2022 Jun 9;13:838166. doi: 10.3389/fpls.2022.838166. eCollection 2022. Front Plant Sci. 2022. PMID: 35755675 Free PMC article.
-
Invasive Rosa rugosa populations outperform native populations, but some populations have greater invasive potential than others.Sci Rep. 2018 Apr 10;8(1):5735. doi: 10.1038/s41598-018-23974-3. Sci Rep. 2018. PMID: 29636551 Free PMC article.
-
Multiple introductions and gene flow in subtropical South American populations of the fireweed, Senecio madagascariensis(Asteraceae).Genet Mol Biol. 2016 Mar;39(1):135-44. doi: 10.1590/1678-4685-GMB-2015-0167. Genet Mol Biol. 2016. PMID: 27007907 Free PMC article.
References
-
- Genton BJ, Shykoff JA, Giraud T (2005) High genetic diversity in French invasive populations of common ragweed, Ambrosia artemisiifolia, as a result of multiple sources of introduction. Molecular Ecology 14: 4275–4285. - PubMed
-
- Solignac M, Cornuet JM, Vautrin D, Le Conte Y, Anderson D, et al. (2005) The invasive Korea and Japan types of Varroa destructor, ectoparasitic mites of the Western honeybee (Apis mellifera), are two partly isolated clones. Proceedings of the Royal Society B-Biological Sciences 272: 411–419. - PMC - PubMed
-
- Kang M, Buckley YM, Lowe AJ (2007) Testing the role of genetic factors across multiple independent invasions of the shrub Scotch broom (Cytisus scoparius). Molecular Ecology 16: 4662–4673. - PubMed
-
- Michel A, Arias RS, Scheffler BE, Duke SO, Netherland M, et al. (2004) Somatic mutation-mediated evolution of herbicide resistance in the nonindigenous invasive plant hydrilla (Hydrilla verticillata). Molecular Ecology 13: 3229–3237. - PubMed
-
- Neve P, Vila-Aiub M, Roux F (2009) Evolutionary-thinking in agricultural weed management. New Phytologist 184: 783–793. - PubMed
Publication types
MeSH terms
Substances
LinkOut - more resources
Full Text Sources
Other Literature Sources
Molecular Biology Databases
