. 2015 Jan;36(1):111-24.
doi: 10.1097/AUD.0000000000000089.

Reliability and clinical test performance of cochlear reflectance

Affiliations

Reliability and clinical test performance of cochlear reflectance

Daniel M Rasetshwane et al. Ear Hear. 2015 Jan.

Abstract

Objective: Cochlear reflectance (CR) is the cochlear contribution to ear-canal reflectance. CR is equivalent to an otoacoustic emission (OAE) deconvolved by forward pressure in the ear canal. Similar to other OAE measures, CR level is related to cochlear status. When measured using wideband noise stimuli, potential advantages of CR over other types of OAEs include (1) the capability to cover a wider frequency range more efficiently by requiring fewer measurements, (2) minimal influence on the recorded emission from the measurement system and middle ear, (3) lack of entrainment of spontaneous OAEs, and (4) easier interpretation because of the existence of an equivalent linear model, which validates the application of linear systems theory. The purposes of this study were to evaluate the reliability, assess the accuracy in a clinical screening paradigm, and determine the relation of CR to audiometric thresholds. Thus, this study represents an initial assessment of the clinical utility of CR.

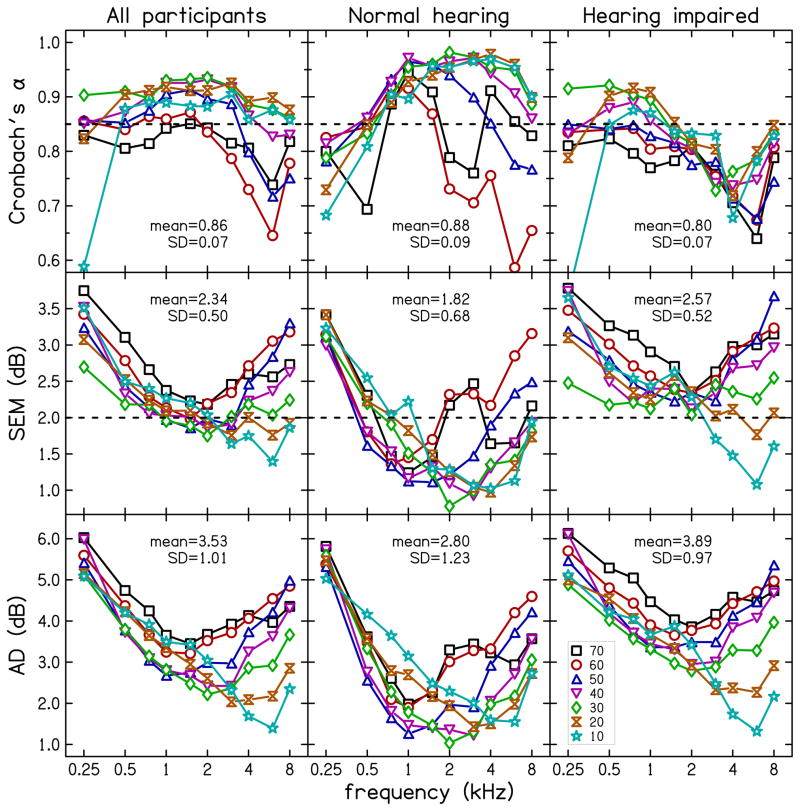
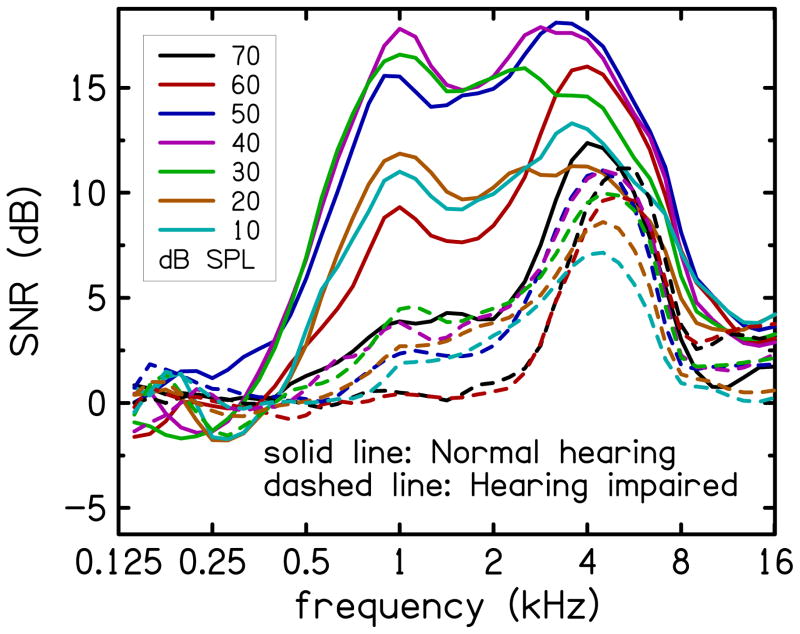
Design: Data were collected from 32 normal-hearing and 58 hearing-impaired participants. A wideband noise stimulus presented at seven stimulus levels (10 to 70 dB SPL, 10 dB steps) was used to elicit the CR. Reliability of CR was assessed using Cronbach's α, standard error of measurement, and absolute differences between CR data from three separate test sessions. Test performance was evaluated using clinical decision theory. The ability of CR to predict audiometric thresholds was evaluated using regression analysis.

Results: CR repeatability across test sessions was similar to that of other clinical measurements. However, both the accuracy with which CR distinguished normal-hearing from hearing-impaired ears and the accuracy with which CR predicted audiometric thresholds were less than those reported in previous studies using distortion-product OAE measurements.

Conclusions: CR measurements are repeatable between test sessions, can be used to predict auditory status, and are related to audiometric thresholds. However, under current conditions, CR does not perform as well as other OAE measurements. Further developments in CR measurement and analysis methods may improve performance. CR has theoretical advantages for cochlear modeling, which may lead to improved interpretation of cochlear status.


Figures

Fig. 1
Fig. 1
Illustration of CR in the time-frequency domain for levels of 20–70 dB SPL. The units of the color map are dB SPL. The region of high energy of the gammatone spectrogram enclosed by NL = 4 cycles, NH = 40 cycles, tH = 0.5 ms and tL = 30 ms includes the energy that we associate with CR. The region below NL includes residual middle-ear and measurement-system activity that was not removed by the subtraction procedure. The activity beyond tL = 30 ms is due to re-reflection of the traveling wave. CR can be observed at the four lowest stimulus levels, and its magnitude decreases with increasing stimulus level. There is no evidence of CR at the highest level. CR persists longer at lower stimulus levels than at higher levels; there is more re-reflected energy close to tL = 30 ms at the lowest level (from Rasetshwane and Neely, 2012).
Fig. 2
Fig. 2
Assessment of reliability using Cronbach’s α (top row), standard error of measurement (SEM; middle row) and absolute differences (AD; bottom row). The columns from left to right show results for all participants, NH participants and HI participants. Values of mean and SD (across frequency and stimulus level) are provided as insets. Good reliability is considered to be α> 0.85 and SEM < 2 (both indicated using dashed lines).
Fig. 3
Fig. 3
Histogram of the mean (across frequency and level) signed difference in CRM between test sessions. The signed differences in CRM between test sessions were roughly normally distributed with a mean of 0.0 dB and SD of 2.9 dB. Ninety percent of the data were within the interval −4.6 to 4.4 dB.
Fig. 4
Fig. 4
Cochlear reflectance magnitude (CRM) for NH participants (thick solid line) and HI participants (thick dashed line). Estimates of the noise magnitude for NH participants (thin dash-dot line) and HI participants (thin dashed line) are also shown. CRM for NH participants is greater than CRM for HI participants, except in the low (< 1 kHz) and high (>8 kHz) frequencies where CRM is indistinguishable from the noise. Also, the noise level for NH participants is lower than that for HI participants.
Fig. 5
Fig. 5
Relationship between audiometric thresholds and CRM. Columns present data at different frequencies, as indicated by labels at the top. Rows present data at different stimulus levels, as indicated by labels on the right. The open circles are the individual data and the lines are the simple regression of thresholds to CRM. Values of R2 for the simple regression lines are included as insets in the figure panels. The regression lines have negative slope, indicating that participants with better hearing have larger CRM.
Fig. 6
Fig. 6
Univariate test performance. The top panel shows area under the receiver operating characteristic curve (AROC) for training-data set and the middle panel shows AROC for validation-data set, both as functions of frequency. The difference in test performance between the two data sets (ΔAROC) is shown in the bottom panel. Stimulus level is the parameter in the figure panels.
Fig. 7
Fig. 7
Multivariate test performance. Top row shows AROC for the training-data set and middle row shows AROC for the validation-data set as functions of frequency. The difference in test performance between the two data sets (ΔAROC) is shown in the bottom row. The left and right columns show results where data reduction used ½-octave bands analysis and PCA, respectively. Stimulus level is the parameter in the figure panels.
Fig. 8
Fig. 8
Standard error (SE) for threshold prediction. Arrangement of results is as described in Fig. 7. ½-octave band analysis results in lower SE for the training-data set, but PCA results in more generalizable threshold predictions (lower ΔSE).
Fig. 9
Fig. 9
R2 for threshold prediction. Arrangement of results is as described in Fig. 7. ½-octave band analysis results in higher correlation for the training-data set, but PCA results in more generalizable threshold predictions (ΔR2 closer to 0).
Fig. 10
Fig. 10
Comparison of test performance of CR to that of SFOAE (Ellison and Keefe, 2005), CEOAE (Mertes and Goodman, 2013) and DPOAE (Kirby et al. 2011).
Fig. 11
Fig. 11
Average SNR (across participants) of cochlear reflectance as function of frequency. Stimulus level is the parameter in the figure. Separate plots are shown for NH (solid lines) and HI participants (dashed lines). The average SNR for NH participants is higher than that for HI participants. The average SNR for both groups is low at low (<0.5 kHz) and high frequencies (≥8 kHz).

References

    1. Allen JB. Measurement of eardrum acoustic impedance. In: Allen JB, Hall JL, Hubbard A, Neely ST, Tubis A, editors. Peripheral Auditory Mechanisms. Springer-Verlag; New York: 1986.
    1. Allen JB. Derecruitment by multiband compression in hearing aids. In: Jesteadt W, editor. Modeling Sensorineural hearing loss. Lawrence Erlbaum Associates; New Jersey: 1997. pp. 99–112.
    1. Boege P, Janssen T. Pure-tone threshold estimation from extrapolated distortion product otoacoustic emissions I/O-functions in normal and cochlear hearing loss ears. J Acoust Soc Am. 2002;111:1810–1818. - PubMed
    1. Brownell WE. Outer hair cell electromotility and otoacoustic emissions. Ear Hear. 1990;11:82–92. - PMC - PubMed
    1. Cronbach LJ. Coefficient alpha and the internal structure of tests. Psychometrika. 1951;16:297–334.

Publication types