

Encephalitis hospitalization rates and inpatient mortality in the United States, 2000-2010
- PMID: 25192177
- PMCID: PMC4156306
- DOI: 10.1371/journal.pone.0104169
Encephalitis hospitalization rates and inpatient mortality in the United States, 2000-2010
Abstract
Background: Encephalitis rates by etiology and acute-phase outcomes for encephalitis in the 21st century are largely unknown. We sought to evaluate cause-specific rates of encephalitis hospitalizations and predictors of inpatient mortality in the United States.
Methods: Using the Nationwide Inpatient Sample (NIS) from 2000 to 2010, a retrospective observational study of 238,567 patients (mean [SD] age, 44.8 [24.0] years) hospitalized within non-federal, acute care hospitals in the U.S. with a diagnosis of encephalitis was conducted. Hospitalization rates were calculated using population-level estimates of disease from the NIS and population estimates from the United States Census Bureau. Adjusted odds of mortality were calculated for patients included in the study.
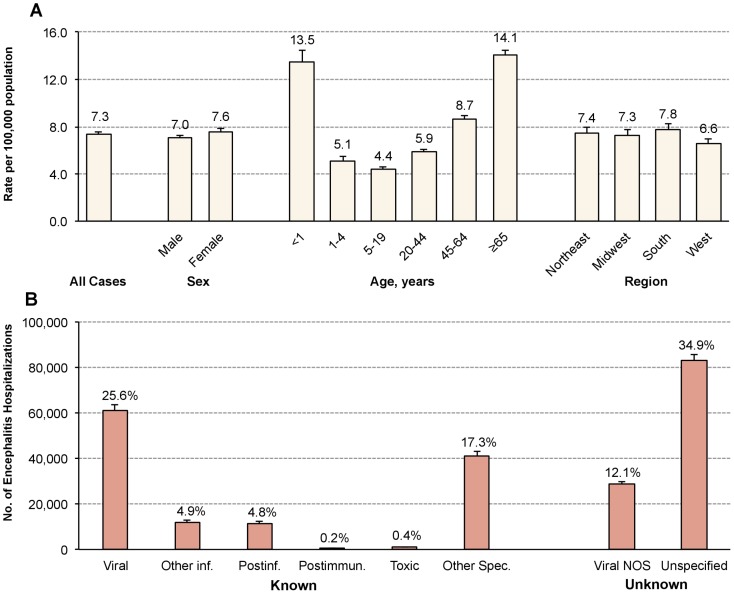
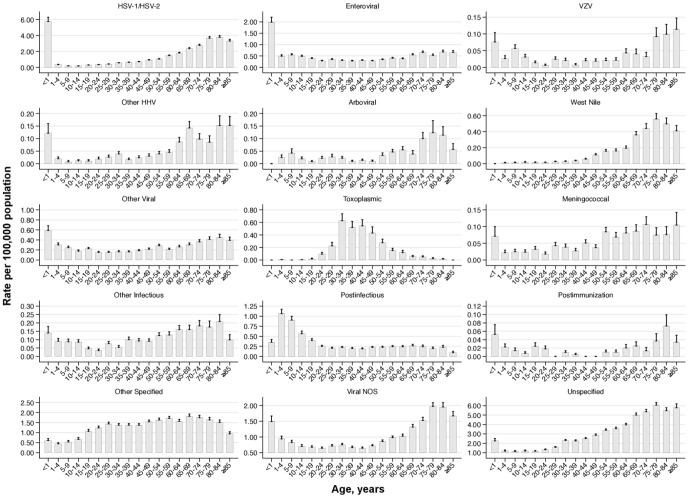
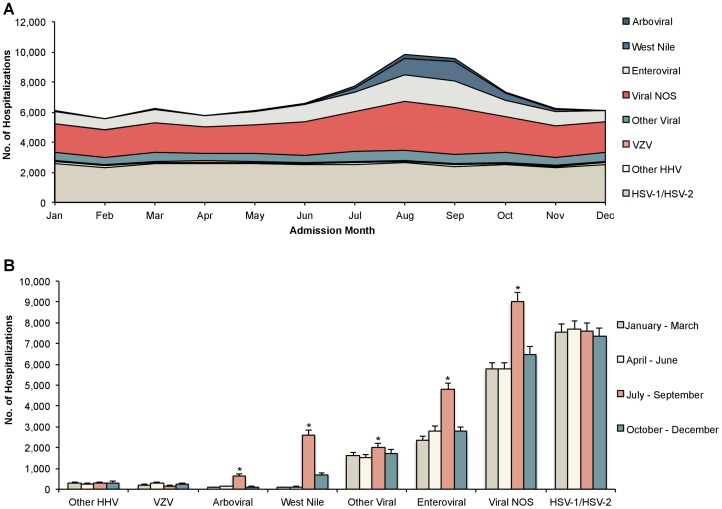
Results: In the U.S. from 2000-2010, there were 7.3±0.2 encephalitis hospitalizations per 100,000 population (95% CI: 7.1-7.6). Encephalitis hospitalization rates were highest among females (7.6±0.2 per 100,000) and those <1 year and >65 years of age with rates of 13.5±0.9 and 14.1±0.4 per 100,000, respectively. Etiology was unknown for approximately 50% of cases. Among patients with identified etiology, viral causes were most common (48.2%), followed by Other Specified causes (32.5%), which included predominantly autoimmune conditions. The most common infectious agents were herpes simplex virus, toxoplasma, and West Nile virus. Comorbid HIV infection was present in 7.7% of hospitalizations. Average length of stay was 11.2 days with mortality of 5.6%. In regression analysis, patients with comorbid HIV/AIDS or cancer had increased odds of mortality (odds ratio [OR] = 1.70; 95% CI: 1.30-2.22 and OR = 2.26; 95% CI: 1.88-2.71, respectively). Enteroviral, postinfectious, toxic, and Other Specified causes were associated with lower odds vs. herpes simplex encephalitis.
Conclusions: While encephalitis and encephalitis-related mortality impose a considerable burden in the U.S. in the 21st Century, the reported demographics of hospitalized encephalitis patients may be changing.
Conflict of interest statement
Figures
References
-
- Glaser CA, Honarmand S, Anderson LJ, Schnurr DP, Forghani B, et al. (2006) Beyond viruses: clinical profiles and etiologies associated with encephalitis. Clin Infect Dis 43: 1565–1577. - PubMed
-
- Mailles A, Stahl JP (2009) Infectious encephalitis in france in 2007: a national prospective study. Clin Infect Dis 49: 1838–1847. - PubMed
-
- Khetsuriani N, Holman RC, Anderson LJ (2002) Burden of encephalitis-associated hospitalizations in the United States, 1988–1997. Clin Infect Dis 35: 175–182. - PubMed
Publication types
MeSH terms
LinkOut - more resources
Full Text Sources
Other Literature Sources
Medical
