. 2014 Dec;13(12):3410-20.
doi: 10.1074/mcp.M113.037291. Epub 2014 Sep 5.

Deep proteomic evaluation of primary and cell line motoneuron disease models delineates major differences in neuronal characteristics

Affiliations

Deep proteomic evaluation of primary and cell line motoneuron disease models delineates major differences in neuronal characteristics

Daniel Hornburg et al. Mol Cell Proteomics. 2014 Dec.

Abstract

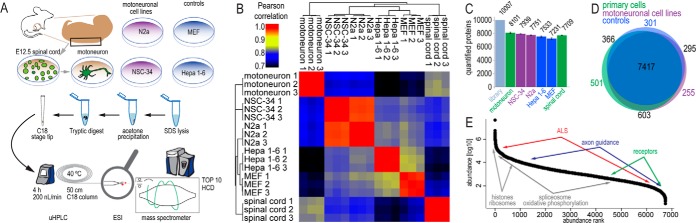
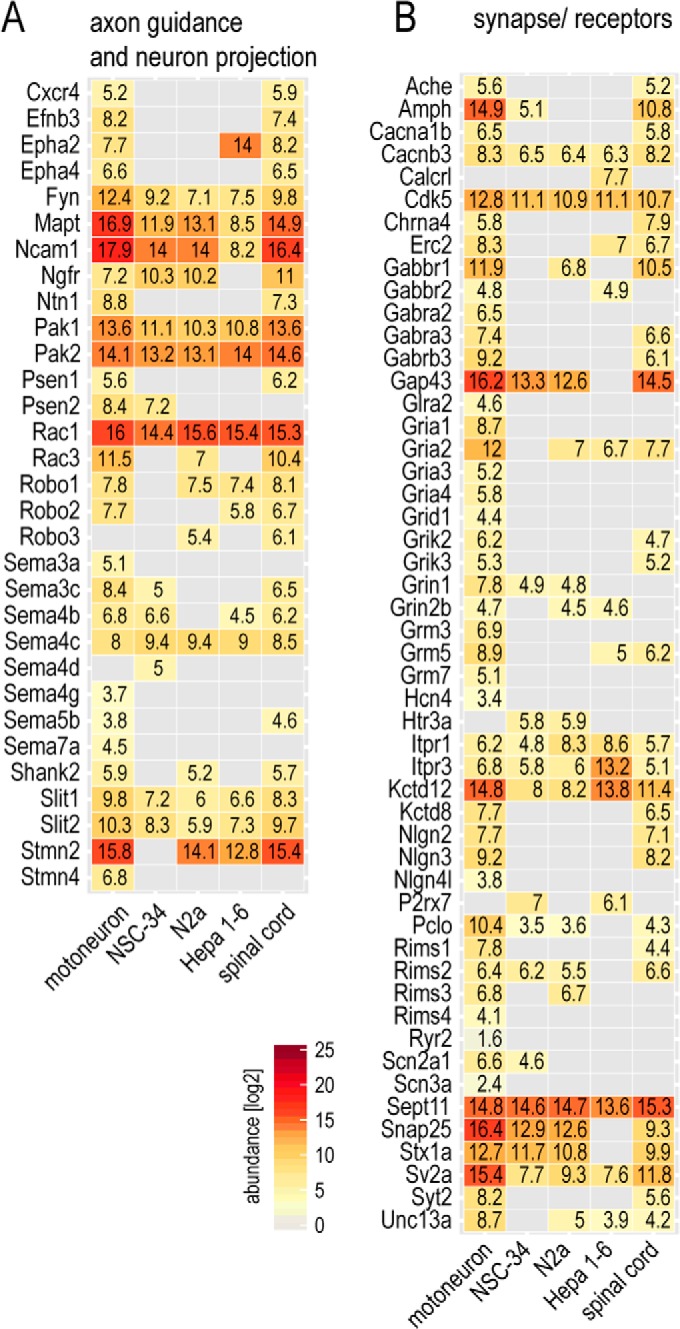
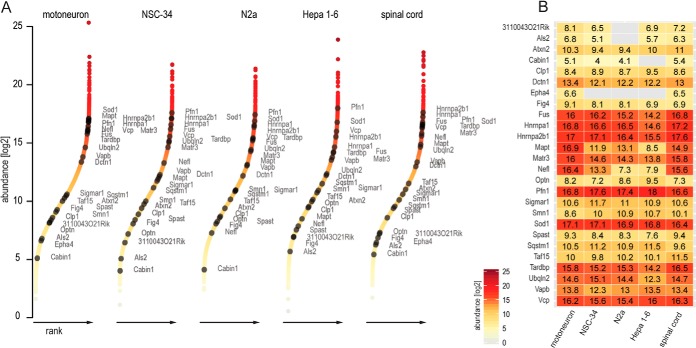
The fatal neurodegenerative disorders amyotrophic lateral sclerosis and spinal muscular atrophy are, respectively, the most common motoneuron disease and genetic cause of infant death. Various in vitro model systems have been established to investigate motoneuron disease mechanisms, in particular immortalized cell lines and primary neurons. Using quantitative mass-spectrometry-based proteomics, we compared the proteomes of primary motoneurons to motoneuron-like cell lines NSC-34 and N2a, as well as to non-neuronal control cells, at a depth of 10,000 proteins. We used this resource to evaluate the suitability of murine in vitro model systems for cell biological and biochemical analysis of motoneuron disease mechanisms. Individual protein and pathway analysis indicated substantial differences between motoneuron-like cell lines and primary motoneurons, especially for proteins involved in differentiation, cytoskeleton, and receptor signaling, whereas common metabolic pathways were more similar. The proteins associated with amyotrophic lateral sclerosis also showed distinct differences between cell lines and primary motoneurons, providing a molecular basis for understanding fundamental alterations between cell lines and neurons with respect to neuronal pathways with relevance for disease mechanisms. Our study provides a proteomics resource for motoneuron research and presents a paradigm of how mass-spectrometry-based proteomics can be used to evaluate disease model systems.


Figures

Fig. 1.
Fig. 1.
Deep proteome analysis of motoneuronal model systems. A, spinal cord from E12.5 mouse embryo was dissected, and cells were isolated. P75NTR-positive cells were enriched in an antibody-panning step and grown in culture for 7 days. Motoneuron-like cell lines (N2a, NSC-34) and control cell lines (MEF, Hepa 1–6) were grown under standard culture conditions. All investigated cellular systems were analyzed via liquid chromatography coupled to high-resolution mass spectrometry following a single-shot strategy. B, Pearson correlation for MS-determined protein abundances (MaxLFQ intensities) from single-shot MS measurements. All replicate correlation values were greater than 0.93, and Pearson correlation between different cellular systems was at least 0.7. C, total number of quantified proteins (summed peptide intensities) in all measurements, including additional replicates of cell lines and spinal cord (“library”) and in individual systems. Between 7,000 and 8,100 proteins were quantified in the individual cellular systems. D, Venn diagram of the distribution of quantified proteins in the investigated cellular systems, grouped by primary cells, motoneuron-like cell lines, and non-neuronal cell lines. E, ranked MaxLFQ normalized protein abundances for motoneurons. Indicated are approximated abundance ranges for proteins involved in neuron-specific and general metabolic processes and in ALS pathology.
Fig. 2.
Fig. 2.
Standard deviation of MaxLFQ quantifications in protein groups within replicates. A, standard deviation of MaxLFQ quantifications in protein groups for triplicates. B, intensity dependence of MaxLFQ standard deviations for all triplicates. The number of data points contributing to each bin is depicted above the bins. C, comparison of standard deviations from technical duplicates and biological triplicates of spinal cord throughout the whole abundance range. Differences between technical and biological replicates are significant (p < 0.0001) for protein intensities of bins 25–30, 30–35, and 35+. The number of protein groups for which standard deviations were calculated is depicted above the bins. Data are plotted as median with 5%–95% percentile.
Fig. 3.
Fig. 3.
Global proteomic comparison of motoneuron-like cell lines, embryonic spinal cord, unrelated cell lines, and primary motoneurons. A, PCA of protein expression values of the different systems. Component 1 and component 2 account for 54.8% of the data variation. B, significant outliers from analysis of variance (FDR cutoff = 1%, S0 fold-change cutoff = 4) are depicted in red in the PCA loading distribution (gray dots). Proteins driving the separation are colored according to the PCA plot in A. C, analyses of enriched annotation (Fisher's exact test) for t test significant (FDR cutoff = 2%, S0 fold-change cutoff = 4) outlier populations. The six most enriched (log 2) annotations from UniProt Keywords (Key), GO biological process (GOBP), GO cellular compartment (GOCC), and KEGG are depicted.
Fig. 4.
Fig. 4.
Evaluation of neuronal pathway enrichments and neuron-specific protein abundances. A–C, pairwise comparison of enriched annotations in different cellular model systems. Annotations are depicted by their enrichment factor and statistical significance, similar to volcano plots for protein populations.
Fig. 5.
Fig. 5.
Evaluation of neuron-specific protein abundances. A, B, abundances of selected proteins that are members of the neuronal annotation classes in Fig. 3. The normalized MS-derived abundance values allow comparisons within and between cellular systems.
Fig. 6.
Fig. 6.
Evaluation of ALS-associated protein abundances. A, ranked abundances of ALS-associated proteins in the context of the entire proteome. B, normalized MS-derived expression values of the same proteins as in A, depicted as a heat map for motoneurons, NSC-34, N2a, Hepa 1–6, and E12.5 spinal cord.

References

    1. Lillo P., Hodges J. R. (2009) Frontotemporal dementia and motor neurone disease: overlapping clinic-pathological disorders. J. Clin. Neurosci. 16, 1131–1135 - PubMed
    1. Mackenzie I. R., Rademakers R., Neumann M. (2010) TDP-43 and FUS in amyotrophic lateral sclerosis and frontotemporal dementia. Lancet Neurol. 9, 995–1007 - PubMed
    1. Al-Chalabi A., Fang F., Hanby M. F., Leigh P. N., Shaw C. E., Ye W., Rijsdijk F. (2010) An estimate of amyotrophic lateral sclerosis heritability using twin data. J. Neurol. Neurosurg. 81, 1324–1326 - PMC - PubMed
    1. Rosen D. R. (1993) Mutations in Cu/Zn superoxide dismutase gene are associated with familial amyotrophic lateral sclerosis. Nature 364, 362. - PubMed
    1. Hadano S., Hand C. K., Osuga H., Yanagisawa Y., Otomo A., Devon R. S., Miyamoto N., Showguchi-Miyata J., Okada Y., Singaraja R., Figlewicz D. A., Kwiatkowski T., Hosler B. A., Sagie T., Skaug J., Nasir J., Brown R. H., Scherer S. W., Rouleau G. A., Hayden M. R., Ikeda J. E. (2001) A gene encoding a putative GTPase regulator is mutated in familial amyotrophic lateral sclerosis 2. Nat. Genet. 29, 166–173 - PubMed

Publication types

MeSH terms