. 2014 Oct 17;289(42):29014-29.
doi: 10.1074/jbc.M114.602474. Epub 2014 Sep 5.

Enhanced in vivo efficacy of a type I interferon superagonist with extended plasma half-life in a mouse model of multiple sclerosis

Affiliations

Enhanced in vivo efficacy of a type I interferon superagonist with extended plasma half-life in a mouse model of multiple sclerosis

Daniel Harari et al. J Biol Chem. .

Abstract

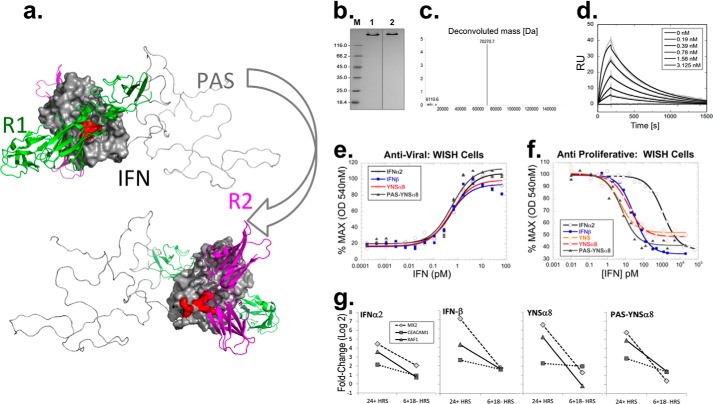
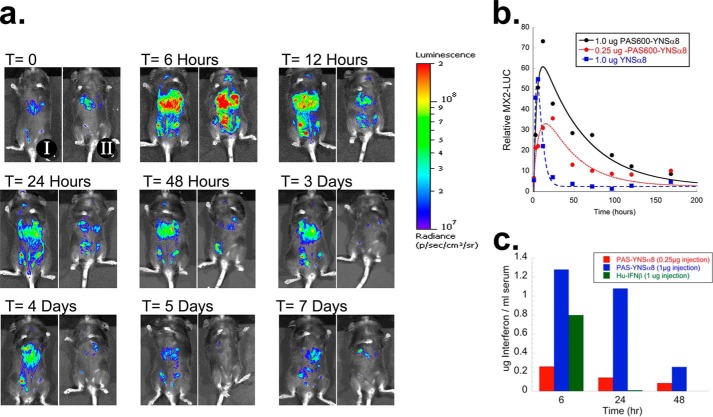
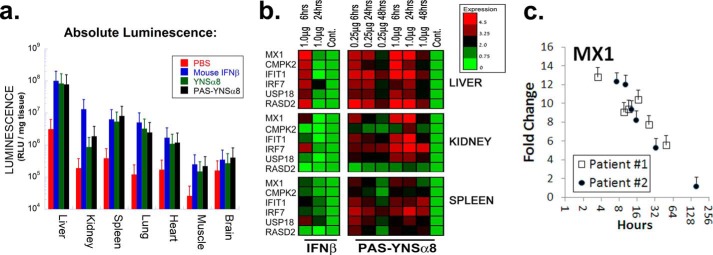
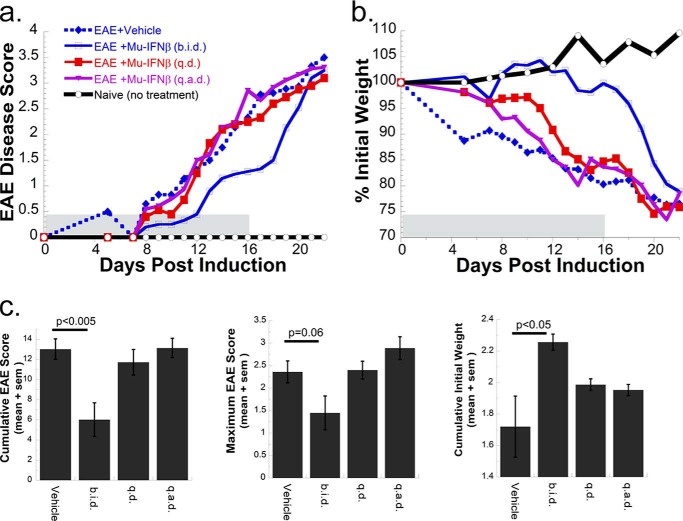
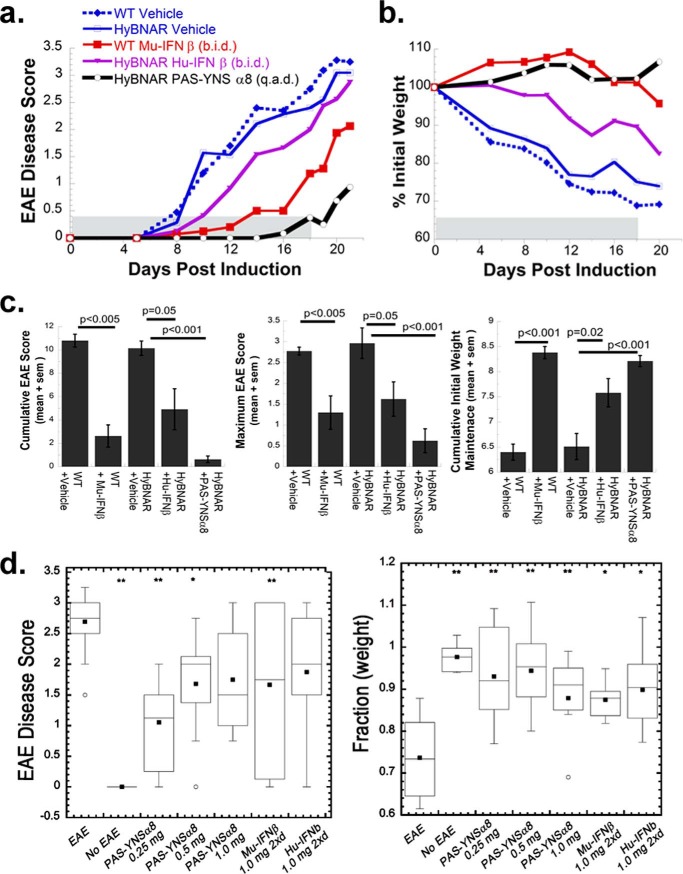
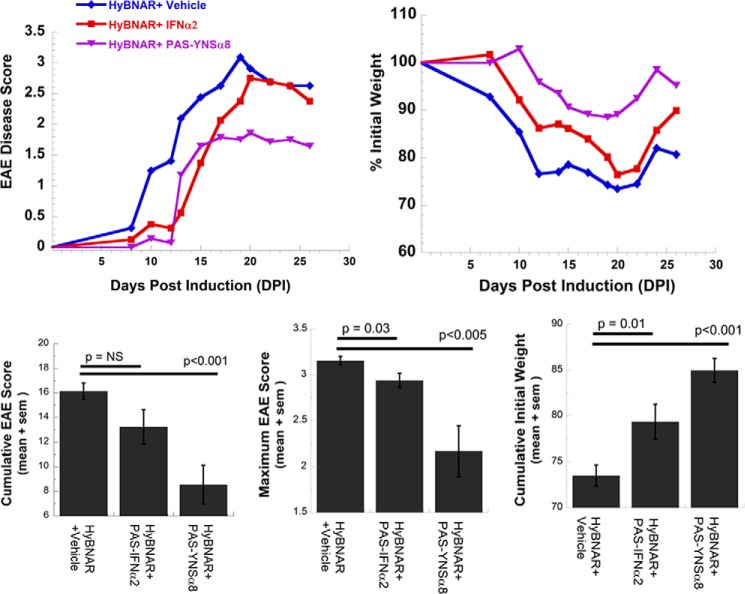
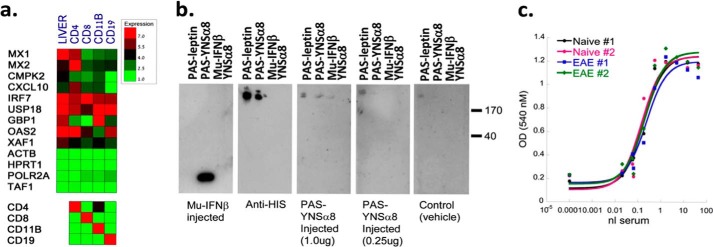
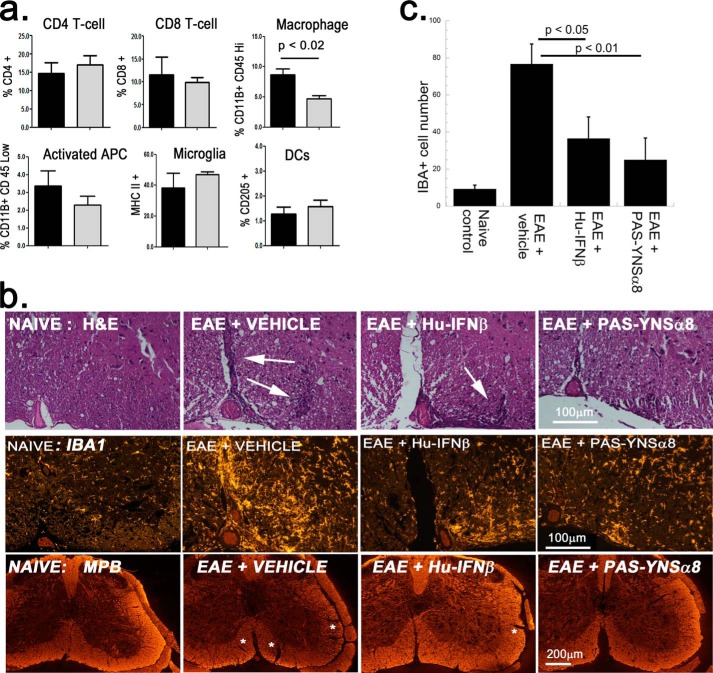
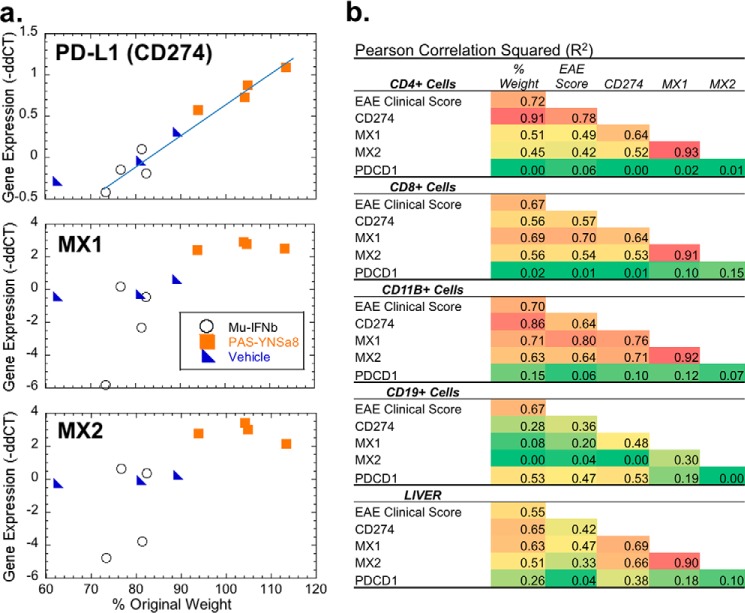
IFNβ is a common therapeutic option to treat multiple sclerosis. It is unique among the family of type I IFNs in that it binds to the interferon receptors with high affinity, conferring exceptional biological properties. We have previously reported the generation of an interferon superagonist (dubbed YNSα8) that is built on the backbone of a low affinity IFNα but modified to exhibit higher receptor affinity than even for IFNβ. Here, YNSα8 was fused with a 600-residue hydrophilic, unstructured N-terminal polypeptide chain comprising proline, alanine, and serine (PAS) to prolong its plasma half-life via "PASylation." PAS-YNSα8 exhibited a 10-fold increased half-life in both pharmacodynamic and pharmacokinetic assays in a transgenic mouse model harboring the human receptors, notably without any detectable loss in biological potency or bioavailability. This long-lived superagonist conferred significantly improved protection from MOG35-55-induced experimental autoimmune encephalomyelitis compared with IFNβ, despite being injected with a 4-fold less frequency and at an overall 16-fold lower dosage. These data were corroborated by FACS measurements showing a decrease of CD11b(+)/CD45(hi) myeloid lineage cells detectable in the CNS, as well as a decrease in IBA(+) cells in spinal cord sections determined by immunohistochemistry for PAS-YNSα8-treated animals. Importantly, PAS-YNSα8 did not induce antibodies upon repeated administration, and its biological efficacy remained unchanged after 21 days of treatment. A striking correlation between increased levels of CD274 (PD-L1) transcripts from spleen-derived CD4(+) cells and improved clinical response to autoimmune encephalomyelitis was observed, indicating that, at least in this mouse model of multiple sclerosis, CD274 may serve as a biomarker to predict the effectiveness of IFN therapy to treat this complex disease.

Keywords: Autoimmune Disease; Biomarker; Drug Development; Interferon; Multiple Sclerosis; Transgenic Mice.


Figures

FIGURE 1.
FIGURE 1.
Development and evaluation of PAS-YNSα8. a, PAS-YNSα8 was depicted using PyMOL, also showing IFNAR1, IFNAR2, and the PAS tag (here with 200 residues in one exemplary random coil conformation) as cartoons in green, magenta, and gray, respectively, using two orientations rotated by 180°. Mutations H57Y, E58N, and Q61S (YNS) and E159K, S160R, and R162K (α8-tail) are depicted on the IFN surface facing IFNAR1 and IFNAR2, respectively. b, analysis of PAS-YNSα8, purified from the periplasmic cell fraction of E. coli, by Coomassie-stained 12% SDS-PAGE under reducing (lane 1) and nonreducing (lane 2) conditions. Lane M, protein size marker. c, ESI-MS analysis of PAS-YNSα8, confirming monodisperse composition and the calculated average molecular mass of 70,271.8 Da (ExPASy ProtParam tool). x-axis: mass (Da); y-axis: counts (×10,000). d, representative real time SPR analysis of PAS-YNSα8 binding to the soluble human IFNAR2-Fc chimera immobilized at ΔRU = 200–250 on a Xantec CMDP sensor chip measured on a BIAcore 2000 instrument and fitted to a 1:1 Langmuir model. The resulting kinetic and affinity parameters are listed in Table 1. e and f, anti-viral (e) and antiproliferative (f) dose-response curves in human WISH cells for different IFN subtypes. g, transcript expression levels of representative IFN-I response genes after stimulation with 1 pm of different human IFN-Is. The cells were exposed to the different IFNs for 24 or 6 h (followed by 18 h in IFN-free medium) before harvest and gene transcript analysis.
FIGURE 2.
FIGURE 2.
Extended pharmacodynamic and pharmacokinetic lifespan of PAS-YNSα8. a, transgenic mice expressing the luciferase reporter gene under the control of the IFN-responsive MX2 promoter (MX2-LUC) were interbred with HyBNAR mice and injected intraperitoneally with 1 μg (IFN component) of either PASylated or non-PASylated YNSα8. At different time points, mice were injected with luciferin and anesthetized, and in vivo luminosity was measured by an image-capturing device (IVIS spectrum). Representative time course images from a mouse injected with PAS-YNSα8 (I, left panels) or a mouse injected with YNSα8 (II, right panels) are shown. b, quantification of in vivo luciferase signal from triplicate mice for each injection group. The data were fitted to a double exponential to model the biodistribution and elimination of the cytokine evoking the luciferase signal. c, mice were injected with 0.25 or 1 μg of PASylated YNSα8 (active IFN), and serum was collected 6, 24, and 48 h after injection. For control, 1.0 μg of human IFNβ was similarly injected, with serum collected at 6 and 24 h. The serum was then functionally quantified for human IFN by an anti-viral assay in human WISH cells.
FIGURE 3.
FIGURE 3.
PAS-YNSα8 activates a robust yet distinct IFN-I signaling response in different tissues. a, mice were injected intraperitoneally with 1.0 μg of the indicated type I IFN or with PBS as control. Six hours after the mice were perfused with PBS, tissues were collected for homogenization and measured for luciferase activity. Absolute values of luciferase activity were standardized per unit wet weight for each tissue. Data for non-PASylated IFN-Is were taken from Ref. . b, left panels, wild type C57BL/6 mice were injected with 1 μg of Mu-IFNβ. Right panels, HyBNAR homozygous mice were injected with either 0.25 or 1 μg of PAS-YNSα8 (active IFN). Control mice were injected with vehicle (PBS). At the indicated time points, livers, kidneys, and spleens were harvested for RNA extraction and cDNA preparation. qPCR was then performed for a panel of IFN-I response genes as indicated at the left. The results representing log2 fold change (−ΔΔCt) are representative of two animals tested per time point. c, MX1 gene expression levels after single dose IFNβ injection into two human individuals (extracted from a microarray study published elsewhere (29)). Pharmacodynamics of IFNβ injection into humans shows a longer half-life in comparison with mice as expected from the rules of allometric scaling. The error bars represent S.E. from triplicate measurements.
FIGURE 4.
FIGURE 4.
Clinical response of MOG peptide-induced EAE to mouse IFNβ. EAE was induced in C57BL/6 female mice, and different groups were treated with alternative regiments of mouse IFNβ therapy (9–10 mice per group). Mouse IFNβ (Mu-IFNβ) treatments commenced immediately prior to MOG injections (0 DPI) with the dosing regiments: 1 μg of IFNβ injected twice daily (b.i.d.), a single 2-μg dose injected once a day (q.d.), or a 2-μg dose injected once every 2 days (q.a.d.). At 11 DPI, all injection dosages were halved but without change in treatment periodicity. The last day of interferon treatment was 16 DPI. Two indexes to measure clinical disease severity are displayed. a, direct clinical measurement of EAE phenotype in a 5-point scale with increased disease symptoms correlating with higher score value. b, mice were weighed the day before EAE induction, and the change (as a percentage) in weight was recorded. c, nonparametric one-way analysis of variance was performed to determine pairwise significance for EAE vehicle control to that of IFN-treated groups measured until the last day of IFN injection (16 DPI). Three different statistical tests measuring cumulative EAE score, maximum EAE score, and cumulative mouse weight are given. A significant reduction in clinical severity and protection from weight loss was noted only for the Mu-IFNβ twice daily (b.i.d.) injected group.
FIGURE 5.
FIGURE 5.
Robust clinical protection of MOG peptide-induced EAE by PAS-YNSα8. EAE was induced in either wild type or in HyBNAR mice, split into groups of n = 5–8, each treated with a different regime of IFN therapy. Wild type and HyBNAR mice were injected with Mu-IFNβ or Hu-IFNβ, respectively, at a dose of 1 μg/injection, 2 injections/day (b.i.d.), whereas PAS-YNSα8 mice (0.25 μg of active IFN per injection) were injected once every 2 days (q.a.d.). a and b, average EAE disease scores (a) and percentage of original mouse weight (b). c, nonparametric one-way analysis of variance was performed from mice until the last day of IFN therapy as described in Fig. 4. d, box plots of EAE clinical score and percentage of weight loss summarizing the accumulated findings from a number of independent EAE experiments (taking the 19 DPI time point from each experiment). The mice were treated with different doses of PAS-YNSα8 (once every second day) or Mu- or Hu-IFNβ used for intraexperimental comparison (1 μg twice daily) for the duration of the experiment. The boxes represent the 25–75% data points, with lines and black squares representing the means and geometric means, respectively. Statistical significance: * p < 0.05; ** p < 0.01.
FIGURE 6.
FIGURE 6.
Low affinity PAS-IFNα2 does not provide sustained clinical protection in MOG peptide-induced EAE. HyBNAR mice were injected with high affinity PAS-YNSα8 or alternatively low affinity PAS-IFNα2 (1 μg of active IFN injected once every 2 days for both 0 → 24 DPI) or with PBS vehicle control (eight mice per experimental group). Low affinity PAS-IFNα2 exerts a delay in disease progression, but this is not sustained over the course of drug treatment. a, average EAE disease score. b, average percentage of initial weight. c, statistical analyses (cumulative for 0 → 20 DPI) demonstrate that the improvement in clinical symptoms for the PAS-IFNα2-treated group is transient. NS, not significant.
FIGURE 7.
FIGURE 7.
No observed loss of IFN-I responsiveness after repeated PAS-YNSα8 injections. a, 24 h after the last of repeated IFN (or vehicle) injections of EAE-induced mice (21 DPI), tissues were extracted, and the indicated splenocyte cell lineages were FACS-purified and processed for qPCR gene expression analysis for 10 IFN-I response genes and a panel of four reference genes (upper box). Samples were also tested for gene expression of immune cell markers as quality control to verify the FACS sort purity (lower box). The given values are averages from two to three mice for each group tested. b, Western blots were performed to test for immunogenicity of IFN-injected mice to PAS-leptin (as a control), PAS-YNSα8, Mu-IFNβ, and YNSα8. Panels from left to right show Western blots developed with the following sera. First panel, a mouse after repeat Mu-IFNβ injections; second panel, a commercial anti-His6 antibody; third panel, a mouse after repeat injections with 1 μg; fourth panel, 0.25 μg PAS-YNSα8 (active IFN); fifth panel, serum from a naïve mouse. c, EAE-induced mice after repeated injections of PAS-YNSα8 (0.25 μg q.a.d., from 0 to 20 DPI) had serum collected 24 h after the final IFN injection. Likewise, serum was also collected 24 h after naïve HyBNAR mice were administered with a single dose of PAS-YNSα8 for comparative purposes. To indirectly measure IFN serum levels, serial dilutions of blood samples were assayed by vesicular stomatitis virus antiviral assay using human WISH cells (see Fig. 1). All blood samples demonstrated a similar EC50 biological response conferred by 0.5 nl of serum, indicating that repeat PAS-YNSα8 treatment did not lead to a reduction in active IFN levels in the mouse compared with the naïve mouse controls. Two representative plots are shown for each treatment type.
FIGURE 8.
FIGURE 8.
PAS-YNSα8 curtails myeloid cell lineage in the EAE CNS. a, infiltrating leukocytes were prepared from spinal cords of EAE-induced HyBNAR mice that were treated with or without PAS-YNSα8 (four animals per group, 18 DPI) and subjected to FACS analysis (± S.E.). Black columns, vehicle-treated EAE mice; gray columns, PAS-YNSα8-treated EAE mice. DCs, dendritic cells. Of the studied populations, only the macrophage lineage was shown to be decreased with statistical significance (p < 0.02, Student's t test; one tail analysis). b, qualitative histological study. Cross-sections of spinal cord from EAE-induced HyBNAR mice 19 DPI (L6 region), treated with vehicle, Hu-IFNβ, or PAS-YNSα8, were stained with hematoxilin and eosin (top panels, H&E), antibodies directed against IBA1 (middle panels), and antibodies directed against myelin basic protein (MBP) (bottom panels). c, quantification of IBA1-positive cells (IBA+) taken from L6 medial region of spinal cord. The average number of cells counted (± S.E.) corresponds to a field view of 10,000 μm2. Measurements were taken from duplicate mice per treatment group. Three slides were quantified per mouse. Significance values correspond to one-way analysis of variance (Tukey post hoc test). Mice from independent EAE experiments were used for the described FACS and immunohistochemistry studies.
FIGURE 9.
FIGURE 9.
Increased expression of PD-L1 directly correlates with improved EAE clinical response. EAE-induced mice were treated for 21 or 27 days with vehicle, mouse IFNβ, or YNSα8 using the same injection regiments described in Fig. 4. Twenty-four hours after the last IFN injections spleens and livers were collected. CD4+, CD8+, CD11+, and CD19+ cells were freshly isolated by FACS analyses, and along with the liver samples all samples were processed for RNA generation. Samples were then tested for gene expression for MX1, MX2, PD-L1 (CD274), and PD1 (PDCD1) as described in Fig. 5. a, gene expression (log2 signal expressed as −ΔΔCT) for spleen-derived CD4+ve cells were plotted against a percentage of pre-EAE induction mouse weight for individual mice. Each point represents the average of duplicate measurements taken for an individual mouse. b, summary of a multivariable correlation analysis including EAE clinical score, percentage of change in mouse body weight and expression of the genes MX1, MX2, CD274, and PDCD1 for four different spleen-derived cell types, as well as from liver homogenate. R2 values are presented.

Similar articles

Cited by

References

    1. Goverman J. (2009) Autoimmune T cell responses in the central nervous system. Nat. Rev. Immunol. 9, 393–407 - PMC - PubMed
    1. Ebers G. C. (2008) Environmental factors and multiple sclerosis. Lancet Neurol. 7, 268–277 - PubMed
    1. International Multiple Sclerosis Genetics Consortium, Wellcome Trust Case Control Consortium 2 (2011) Genetic risk and a primary role for cell-mediated immune mechanisms in multiple sclerosis. Nature 476, 214–219 - PMC - PubMed
    1. International Multiple Sclerosis Genetics Consortium (IMSGC) (2013) Analysis of immune-related loci identifies 48 new susceptibility variants for multiple sclerosis. Nat. Genet. 45, 1353–1360 - PMC - PubMed
    1. McFarland H. F., Martin R. (2007) Multiple sclerosis: a complicated picture of autoimmunity. Nat. Immunol. 8, 913–919 - PubMed

Publication types

MeSH terms