. 2014 Oct 17;289(42):29123-34.
doi: 10.1074/jbc.M114.571687. Epub 2014 Sep 5.

Critical roles of interdomain interactions for modulatory ATP binding to sarcoplasmic reticulum Ca2+-ATPase

Affiliations

Critical roles of interdomain interactions for modulatory ATP binding to sarcoplasmic reticulum Ca2+-ATPase

Johannes D Clausen et al. J Biol Chem. .

Abstract

ATP has dual roles in the reaction cycle of sarcoplasmic reticulum Ca(2+)-ATPase. Upon binding to the Ca2E1 state, ATP phosphorylates the enzyme, and by binding to other conformational states in a non-phosphorylating modulatory mode ATP stimulates the dephosphorylation and other partial reaction steps of the cycle, thereby ensuring a high rate of Ca(2+) transport under physiological conditions. The present study elucidates the mechanism underlying the modulatory effect on dephosphorylation. In the intermediate states of dephosphorylation the A-domain residues Ser(186) and Asp(203) interact with Glu(439) (N-domain) and Arg(678) (P-domain), respectively. Single mutations to these residues abolish the stimulation of dephosphorylation by ATP. The double mutation swapping Asp(203) and Arg(678) rescues ATP stimulation, whereas this is not the case for the double mutation swapping Ser(186) and Glu(439). By taking advantage of the ability of wild type and mutant Ca(2+)-ATPases to form stable complexes with aluminum fluoride (E2·AlF) and beryllium fluoride (E2·BeF) as analogs of the E2·P phosphoryl transition state and E2P ground state, respectively, of the dephosphorylation reaction, the mutational effects on ATP binding to these intermediates are demonstrated. In the wild type Ca(2+)-ATPase, the ATP affinity of the E2·P phosphoryl transition state is higher than that of the E2P ground state, thus explaining the stimulation of dephosphorylation by nucleotide-induced transition state stabilization. We find that the Asp(203)-Arg(678) and Ser(186)-Glu(439) interdomain bonds are critical, because they tighten the interaction with ATP in the E2·P phosphoryl transition state. Moreover, ATP binding and the Ser(186)-Glu(439) bond are mutually exclusive in the E2P ground state.

Keywords: ATPase; Calcium ATPase; Enzyme Kinetics; Membrane Energetics; Membrane Enzyme; Membrane Transport; Phosphorylation; Site-directed Mutagenesis.


Figures

SCHEME 1.
SCHEME 1.
Ca2+-ATPase reaction cycle. Major conformational changes and substrate binding and dissociation steps are shown. Boxed ATP indicates steps for which the rate is enhanced by additional binding of ATP or MgATP in a non-phosphorylating mode, i.e. without being hydrolyzed (“modulatory ATP”). Encircled AlF, VO43 (orthovanadate), and BeF are indicated below the reaction intermediates, for which stable analogs can be formed by incubation of Ca2+-deprived enzyme with the respective phosphate analogs in the presence of Mg2+.
FIGURE 1.
FIGURE 1.
Comparison of the structural arrangements near the Asp203-Arg678 and Ser186-Glu439 interaction sites in Ca2+-ATPase in various crystal structures. The Protein Data Bank accession codes corresponding to the structures shown are 3B9R (E2·AlF·AMP-PCP state (9)), 1T5S (Ca2E1·AMP-PCP state (10)), 3AR8 (E2·AlF·TNP-AMP state (43)), and 3AR9 (E2·BeF·TNP-AMP state (43)). Amino acid side chains are shown for residues discussed in the text. The Asp203-Arg678 and Ser186-Glu439 interactions as well as the Glu183-H2O-AlF-Asp351 bonding network are indicated by green dotted lines. Aluminum atoms are shown in gray, nitrogen in blue, oxygen in red, phosphorous in orange, and fluoride in cyan. Carbon atoms are shown in gray for the side chains and yellow for the nucleotides.
FIGURE 2.
FIGURE 2.
Rate of E2P dephosphorylation in the absence of ATP. The microsomes containing the enzyme were incubated with 32Pi in the presence of Mg2+, as described under “Experimental Procedures.” The accumulated E2P phosphoenzyme was then chased by dilution into ATP-free dephosphorylation medium containing excess EDTA to remove Mg2+, followed by acid quenching after various time intervals as indicated on the abscissa. The dephosphorylation rate constants, obtained by fitting of an exponential decay function to the data, are listed in Table 2 (“basal rate”, k0). The broken lines reproduce the wild type data from the upper left panel for direct comparison.
FIGURE 3.
FIGURE 3.
ATP dependence of the rate of E2P dephosphorylation. Dephosphorylation of phosphoenzyme formed in the presence of 32Pi was carried out as described in the legend to Fig. 2, except that ATP at the indicated concentrations was included in the dephosphorylation medium. The dephosphorylation rate constants are shown here as a function of the ATP concentration. The parameters derived by fitting a hyperbolic function kobs = k0 + (kmaxk0) [ATP]/(K0.5 + [ATP]) are listed in Table 2. The broken lines reproduce the wild type data from the upper left panel for direct comparison. Note the different ordinate scales of the panels.
FIGURE 4.
FIGURE 4.
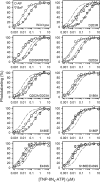
TNP-8N3-ATP concentration dependence of photolabeling in stable E2P-like states. The enzyme was preincubated with AlF or BeF as described under “Experimental Procedures” and subjected to TNP-8N3-ATP photolabeling at the indicated concentrations of TNP-8N3-ATP. In each case, the maximum level of specific labeling was defined as 100%. Symbols for all panels are indicated in the upper left panel. The broken lines reproduce the wild type data from the upper left panel for direct comparison. The affinity constants extracted from fits of a hyperbolic function to the data (cf. “Experimental Procedures”) are listed in Table 3.
FIGURE 5.
FIGURE 5.
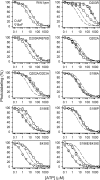
ATP concentration dependence of inhibition of TNP-8N3-ATP photolabeling in stable E2P-like states. The enzyme was preincubated with AlF or BeF, as described under “Experimental Procedures” and subjected to photolabeling at a TNP-8N3-ATP concentration of 3 times the K0.5 for TNP-8N3-ATP in the presence of the indicated concentrations of ATP. In each case, the maximum level of specific labeling was defined as 100%. Symbols for all panels are indicated in the upper left panel. The broken lines reproduce the wild type data from the upper left panel for direct comparison. The affinity constants extracted from fits of the Hill equation for inhibition to the data (cf. “Experimental Procedures”) are listed in Table 3. Note the reversed order of ATP affinity in E2·AlF and E2·BeF of mutants S186E, E439S, and S186E/E439S, relative the wild type enzyme.
FIGURE 6.
FIGURE 6.
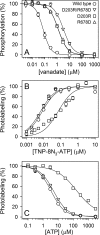
Nucleotide binding to wild type and mutants D203R, R678D, and D203R/R678D stabilized in the E2·P phosphoryl transition state-like conformation by orthovanadate. A, affinity for orthovanadate determined by inhibition of phosphorylation from [γ-32P]ATP. The enzyme was preincubated with the indicated concentrations of orthovanadate as described under “Experimental Procedures,” and the degree of inhibition was then determined by phosphorylation for 15 s at 0 °C with 5 μm [γ-32P]ATP following addition of CaCl2 to a final concentration of 2.5 mm, giving a free Ca2+ concentration of 0.5 mm. In each case, the maximum phosphorylation level was taken as 100%. The lines show the best fits of the Hill equation for inhibition to the data giving the following affinity constants: wild type, K0.5 = 0.075 ± 0.005 μm (n = 2); D203R, K0.5 = 1.22 ± 0.07 μm (n = 2); R678D, K0.5 = 1.25 ± 0.07 μm (n = 2); D203R/R678D, K0.5 = 3.25 ± 0.29 μm (n = 2). B, TNP-8N3-ATP concentration dependence of photolabeling of enzyme in the E2·orthovanadate state. The enzyme was preincubated with orthovanadate as described under “Experimental Procedures,” at a saturating concentration of 0.5 mm, and subjected to TNP-8N3-ATP photolabeling at the indicated concentrations of TNP-8N3-ATP. In each case, the maximum level of specific labeling was defined as 100%. The lines show the best fits of a hyperbolic function to the data giving the following affinity constants: wild type, K0.5 = 8.3 ± 0.7 nm (n = 2); D203R, K0.5 = 70.0 ± 8.8 nm (n = 2); D203R/R678D, K0.5 = 6.6 ± 0.4 nm (n = 2). For R678D, no specific labeling by TNP-8N3-ATP was obtained. C, ATP concentration dependence of inhibition of TNP-8N3-ATP photolabeling of enzyme in the E2·orthovanadate state. Enzyme preincubated with 0.5 mm orthovanadate was subjected to TNP-8N3-ATP photolabeling at 3 times the K0.5 for TNP-8N3-ATP in the presence of the indicated concentrations of ATP. For R678D, the lack of specific TNP-8N3-ATP labeling precluded determination of ATP dependence. In each case, the maximum level of specific labeling was defined as 100%. The lines show the best fits of the Hill equation for inhibition to the data giving the following affinity constants: wild type, KD = 0.86 ± 0.03 μm (n = 2); D203R, K0.5 = 41.1 ± 8.2 μm (n = 2); D203R/R678D, K0.5 = 1.27 ± 0.07 μm (n = 2). Symbols for all three panels are indicated in the upper panel.

Similar articles

Cited by

References

    1. Møller J. V., Olesen C., Winther A. M., Nissen P. (2010) The sarcoplasmic Ca2+-ATPase: design of a perfect chemi-osmotic pump. Q. Rev. Biophys. 43, 501–566 - PubMed
    1. Toyoshima C. (2009) How Ca2+-ATPase pumps ions across the sarcoplasmic reticulum membrane. Biochim. Biophys. Acta 1793, 941–946 - PubMed
    1. Toyoshima C., Iwasawa S., Ogawa H., Hirata A., Tsueda J., Inesi G. (2013) Crystal structures of the calcium pump and sarcolipin in the Mg2+-bound E1 state. Nature 495, 260–264 - PubMed
    1. Clausen J. D., Bublitz M., Arnou B., Montigny C., Jaxel C., Møller J. V., Nissen P., Andersen J. P., le Maire M. (2013) SERCA mutant E309Q binds two Ca2+ ions but adopts a catalytically incompetent conformation. EMBO J. 32, 3231–3243 - PMC - PubMed
    1. Clausen J. D., Vilsen B., McIntosh D. B., Einholm A. P., Andersen J. P. (2004) Glutamate 183 in the conserved TGES motif of domain A of sarcoplasmic reticulum Ca2+-ATPase assists in catalysis of E2/E2P partial reactions. Proc. Natl. Acad. Sci. U.S.A. 101, 2776–2781 - PMC - PubMed

Publication types

Substances

LinkOut - more resources