. 2014 Sep 30;5(18):8442-51.
doi: 10.18632/oncotarget.2319.

Regulatory effects of a Mnk2-eIF4E feedback loop during mTORC1 targeting of human medulloblastoma cells

Affiliations

Regulatory effects of a Mnk2-eIF4E feedback loop during mTORC1 targeting of human medulloblastoma cells

Frank Eckerdt et al. Oncotarget. .

Abstract

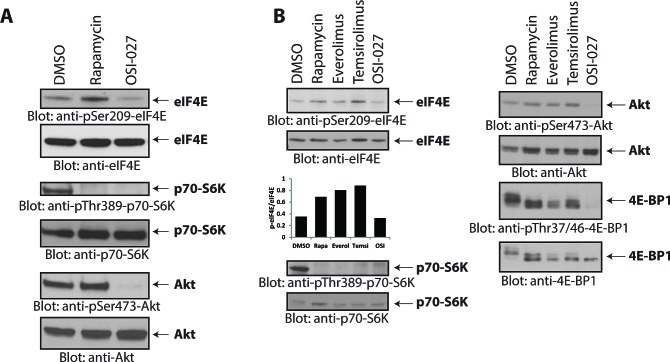
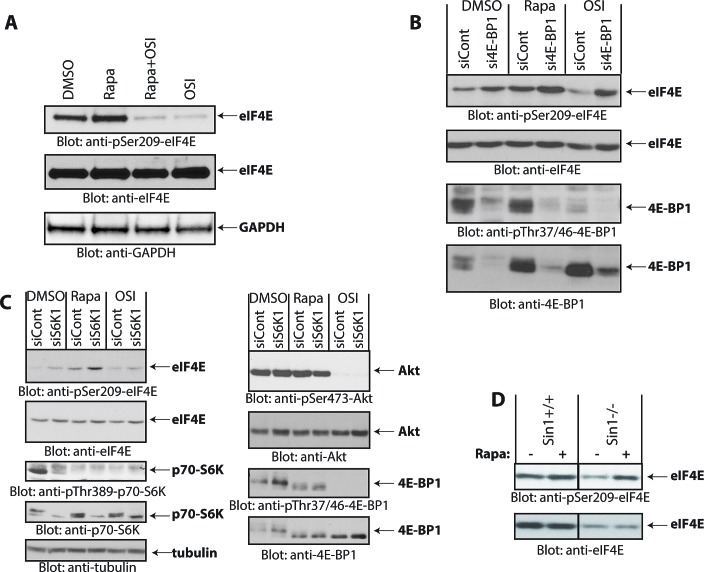
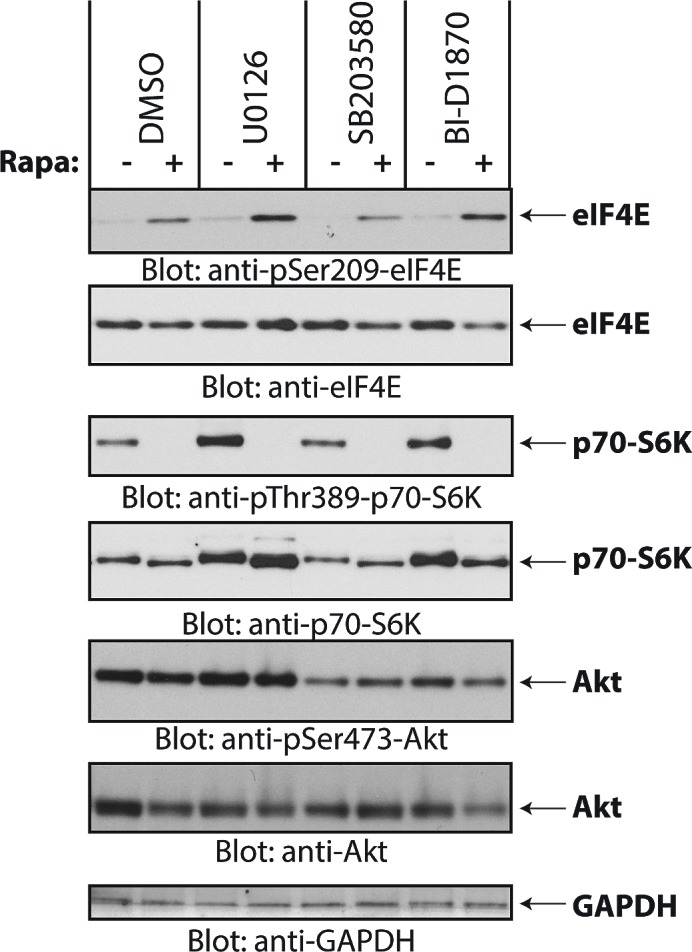
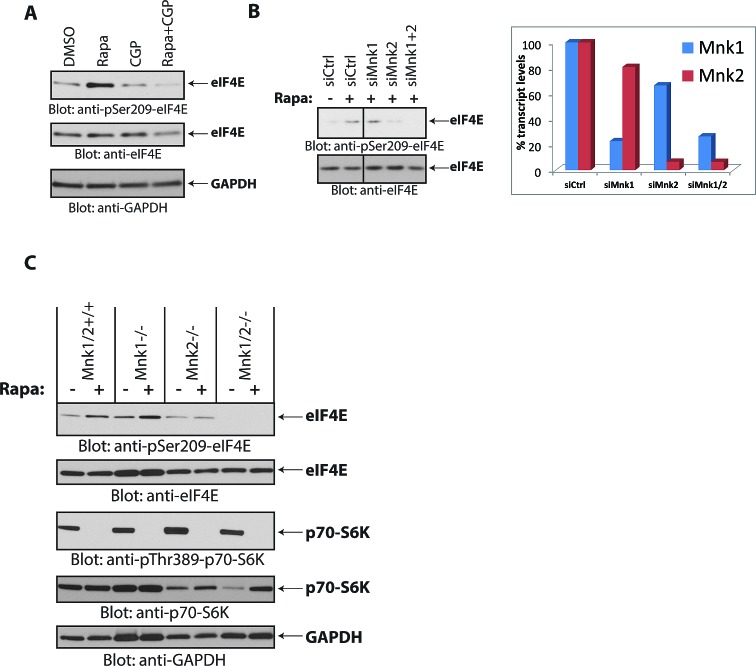
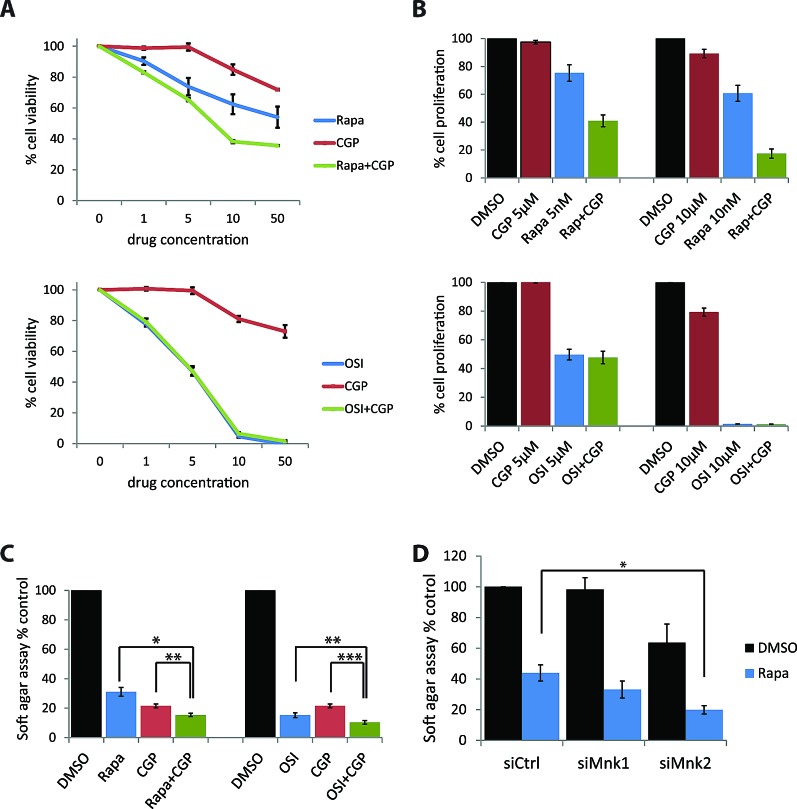
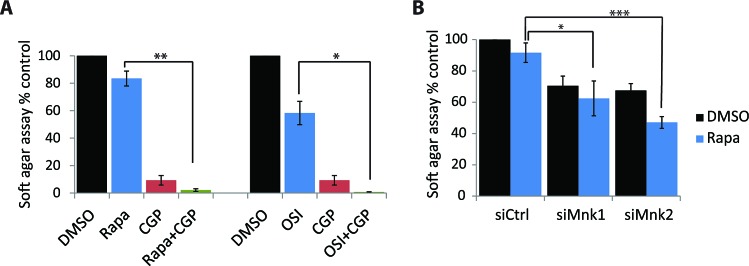
The mTOR pathway controls mRNA translation of mitogenic proteins and is a central regulator of metabolism in malignant cells. Development of malignant cell resistance is a limiting factor to the effects of mTOR inhibitors, but the mechanisms accounting for such resistance are not well understood. We provide evidence that mTORC1 inhibition by rapamycin results in engagement of a negative feedback regulatory loop in malignant medulloblastoma cells, involving phosphorylation of the eukaryotic translation-initiation factor eIF4E. This eIF4E phosphorylation is Mnk2- mediated, but Mnk1-independent, and acts as a survival mechanism for medulloblastoma cells. Pharmacological targeting of Mnk1/2 or siRNA-mediated knockdown of Mnk2 sensitizes medulloblastoma cells to mTOR inhibition and promotes suppression of malignant cell proliferation and anchorage-independent growth. Altogether, these findings provide evidence for the existence of a Mnk2-controlled feedback loop in medulloblastoma cells that accounts for resistance to mTOR inhibitors, and raise the potential for combination treatments of mTOR and Mnk inhibitors for the treatment of medulloblastoma.


Figures

Figure 1
Figure 1. Rapalogs increase phosphorylation of eIF4E on Ser-209 in medulloblastoma cells
(A) Daoy cells were incubated with rapamycin (20 nM) or OSI-027 (5 μM) for 90 minutes. Cell lysates were resolved by SDS-PAGE and immunoblotted with antibodies against the phosphorylated forms of eIF4E (pSer-209), p70-S6K (pThr-389), and Akt (pSer-473). The corresponding same blots were stripped and reprobed with antibodies against eIF4E, p70-S6K and Akt, respectively, as indicated. (B) Daoy cells were incubated with rapamycin (20 nM), everolimus (200 nM), temsirolimus (5 μM) or OSI-027 (5 μM) for 90 min. Cell lysates were resolved by SDS-PAGE and immunoblotted with antibodies against the phosphorylated forms of eIF4E (pSer-209), p70-S6K (pThr-389), Akt (pSer-473) and 4E-BP1 (pThr-37/46). The corresponding same blots were stripped and reprobed with antibodies against total eIF4E, p70-S6K, Akt and 4E-BP1, respectively as indicated. The bands from the anti-phospho-eIF4E and anti-eIF4E blots were quantitated by densitometry using ImageJ, and data were expressed as ratios of p-eIF4E/eIF4E, as shown in the bar graphs below the top 2 blots.
Figure 2
Figure 2. Rapamycin-induced phosphorylation of eIF4E
(A) Daoy cells were incubated with rapamycin (25 nM) and/or OSI-027 (10 μM) for 90 min. Cell lysates were resolved by SDS-PAGE and immunoblotted with antibodies against the phosphorylated form of eIF4E (pSer-209) or GAPDH (upper and lower panels). Equal amounts of cell lysates from the same experiment were analyzed in parallel by SDS-PAGE and immunoblotted against eIF4E (middle panel). (B) Daoy cells were transfected with control or 4E-BP1 siRNA. After 48 hours, cells were treated with rapamycin (20 nM) or OSI-027 (5 μM) for 90 min. Cell lysates were resolved by SDS-PAGE and immunoblotted with antibodies against the phosphorylated forms of eIF4E (pSer-209) or 4E-BP1 (pThr-37/46). The same blot was stripped and reprobed with antibodies against eIF4E or 4E-BP1, as indicated. (C) Daoy cells were transfected with either control or p70-S6K1 siRNA. After 48 hours, cells were treated with rapamycin (20 nM) or OSI-027 (5 μM) for 90 min. Cell lysates were resolved by SDS-PAGE and immunoblotted with antibodies against the phosphorylated forms of eIF4E (pSer-209), p70-S6K (pThr-389), Akt (pSer-473), 4E-BP1 (pThr-37/46) or tubulin. The corresponding same blots were stripped and reprobed with antibodies against total eIF4E, p70-S6K, Akt or 4E-BP1, as indicated. (D) Sin1+/+ and Sin1-/- MEFs were treated with Rapamycin (20 nM) for 90 min and equal amounts of protein were processed for immunoblotting with antibodies for phosphorylated eIF4E (pSer-209) (upper panel). The immunoblot with antibodies against total eIF4E protein was from lysates from the same experiment analyzed in parallel by SDS-PAGE (lower panel).
Figure 3
Figure 3. Rapamycin-induced phosphorylation of eIF4E is independent of the MAPK pathways
Daoy cells were pretreated with DMSO or inhibitors for MEK (U0126, 10 μM), p38 (SB203580, 20 μM), Rsk1 (BI-D1870, 10 μM), for 60 min before addition of rapamycin (20 nM) for 2 hours. Equal amounts of protein were resolved by SDS-PAGE and processed by immunoblotting using antibodies for the phosphorylated forms of eIF4E (pSer-209), p70-S6K (pSer-389) and Akt (pSer-473). The blots were stripped and reprobed with antibodies for eIF4E, p70-S6K, Akt and GAPDH, as indicated.
Figure 4
Figure 4. Mnk2 is required for rapamycin-induced eIF4E phosphorylation
(A) Daoy cells were treated with rapamycin (20 nM) and/or CGP57380 (10 μM) for 90 min. Equal amounts of protein were processed by immunoblotting using antibodies for the phosphorylated form of eIF4E (pSer-209) or GAPDH. The membrane was stripped and reprobed with an antibody for eIF4E. (B) (Left) Daoy cells were transfected with control, Mnk1, Mnk2 and Mnk1+Mnk2 siRNAs. After 48 hours, cells were treated with rapamycin (20 nM) for 90 min, as indicated. Cell lysates were resolved by SDS-PAGE and immunoblotted with antibodies against the phosphorylated form of eIF4E (pSer-209). The same membrane was stripped and reprobed with an antibody for eIF4E. (Right) mRNA expression of Mnk1 and Mnk2 genes from cells transfected with the indicated siRNAs from the same experiment shown on the left panel, was assessed by quantitative RT-PCR in triplicates, using GAPDH for normalization. Data are expressed as percentages of control siRNA transfected cells. (C) Mnk1/2+/+, Mnk1-/-, Mnk2-/- and Mnk1/2-/- (DKO) MEFs were treated with rapamycin (20 nM) for 90 min. Equal amounts of protein were resolved by SDS-PAGE and immunoblotted with antibodies against phosphorylated eIF4E (pSer-209) or p70-S6K (pThr-389). Membranes were stripped and reprobed with antibodies for eIF4E, p70-S6K and GAPDH.
Figure 5
Figure 5. Simultaneous Mnk inhibition increases rapamycin-mediated inhibition of cell proliferation and colony formation
(A) Daoy cells were incubated for five days with increasing concentrations of CGP57380 (1, 5, 10, 50 μM) in the presence or absence of increasing concentrations of rapamycin (1, 5, 10, 50 nM, upper panel) or OSI-027 (1, 5, 10, 50 μM, lower panel). Subsequently, cells were subjected to WST-1 proliferation assays. Means ± SE of the values from 3 independent experiments (each done in triplicates), are shown. Data are expressed as percentages of control DMSO treated samples. (B) Daoy cells were treated with the indicated concentrations of CGP57380, in the presence or absence of the indicated concentrations of rapamycin or OSI-027. After five days, cell numbers were counted using an automated cell counter. Means ± SE are shown as values of 3 independent experiments. Data are expressed as percentages of control DMSO treated samples. (C) Daoy cells were plated in soft-agar and treated with CGP57380 (10 μM) with or without rapamycin (10 nM) or OSI-027 (0.5 μM). After 7 days, colony formation was quantified using the fluorescent cell stain CyQUANT GR Dye (Cell Biolabs Inc.) in the Synergy HT Plate reader. Means ± SE of the values from 4 independent experiments are shown. Data are expressed as percentages of DMSO treated samples. *, p < 0.05, **, p < 0.005, ***, p <0.0005 using a paired t-test (D) Daoy cells were transfected with control, Mnk1, or Mnk2 siRNA. After 48 hours, cells were counted and equal numbers were plated in soft-agar and treated with DMSO as a control, rapamycin (10 nM) or OSI-027 (0.5 μM). Cells were incubated for 7 days. Colony formation was quantified using the fluorescent cell stain CyQUANT GR Dye (Cell Biolabs Inc.) in the Synergy HT Plate reader. Means ± SE are shown from 6 independent experiments. Data are expressed as percentages of DMSO treated control siRNA transfected samples. *, p < 0.05 using a paired t-test.
Figure 6
Figure 6. Inhibition of Mnk increases the inhibitory effects of mTOR inhibitors on D556 medulloblastoma cells
(A) D556 cells were plated in soft-agar and treated with CGP57380 (10 μM) and incubated with or without rapamycin (20 nM) or OSI-027 (0.5 μM). Cells were incubated for 7 days. Colony formation was quantified using the fluorescent cell stain CyQUANT GR Dye (Cell Biolabs Inc.) in the Synergy HT Plate reader. Means ± SE are shown from 4 independent experiments. *, p < 0.05, **, p < 0.005 using a paired t-test (B) D556 cells were transfected with either control, Mnk1 or Mnk2 siRNA. After 48 hours, cells were counted and equal numbers were plated in soft-agar and treated with DMSO as control or rapamycin (10 nM). Cells were incubated for 7 days. Colony formation was quantified using the fluorescent cell stain CyQUANT GR Dye (Cell Biolabs Inc.) in the Synergy HT Plate reader. Means ± SE are shown from 4 independent experiments. Data are expressed as percentages of DMSO treated control siRNA transfected samples. *, p < 0.05, ***, p < 0.0005 using a paired t-test.

Similar articles

Cited by

References

    1. Pui CH, Gajjar AJ, Kane JR, Qaddoumi IA, Pappo AS. Challenging issues in pediatric oncology. Nat Rev Clin Oncol. 2011;8(9):540–549. - PMC - PubMed
    1. Jones DT, Jager N, Kool M, Zichner T, Hutter B, Sultan M, Cho YJ, Pugh TJ, Hovestadt V, Stutz AM, Rausch T, Warnatz HJ, Ryzhova M, Bender S, Sturm D, Pleier S, et al. Dissecting the genomic complexity underlying medulloblastoma. Nature. 2012;488(7409):100–105. - PMC - PubMed
    1. Robinson G, Parker M, Kranenburg TA, Lu C, Chen X, Ding L, Phoenix TN, Hedlund E, Wei L, Zhu X, Chalhoub N, Baker SJ, Huether R, Kriwacki R, Curley N, Thiruvenkatam R, et al. Novel mutations target distinct subgroups of medulloblastoma. Nature. 2012;488(7409):43–48. - PMC - PubMed
    1. Pugh TJ, Weeraratne SD, Archer TC, Pomeranz Krummel DA, Auclair D, Bochicchio J, Carneiro MO, Carter SL, Cibulskis K, Erlich RL, Greulich H, Lawrence MS, Lennon NJ, McKenna A, Meldrim J, Ramos AH, et al. Medulloblastoma exome sequencing uncovers subtype-specific somatic mutations. Nature. 2012;488(7409):106–110. - PMC - PubMed
    1. Northcott PA, Jones DT, Kool M, Robinson GW, Gilbertson RJ, Cho YJ, Pomeroy SL, Korshunov A, Lichter P, Taylor MD, Pfister SM. Medulloblastomics: the end of the beginning. Nat Rev Cancer. 2012;12(12):818–834. - PMC - PubMed

Publication types

MeSH terms

Substances

LinkOut - more resources