. 2014 Oct 16;124(16):2569-74.
doi: 10.1182/blood-2014-06-584607. Epub 2014 Sep 5.

Erythroferrone contributes to recovery from anemia of inflammation

Affiliations

Erythroferrone contributes to recovery from anemia of inflammation

Léon Kautz et al. Blood. .

Abstract

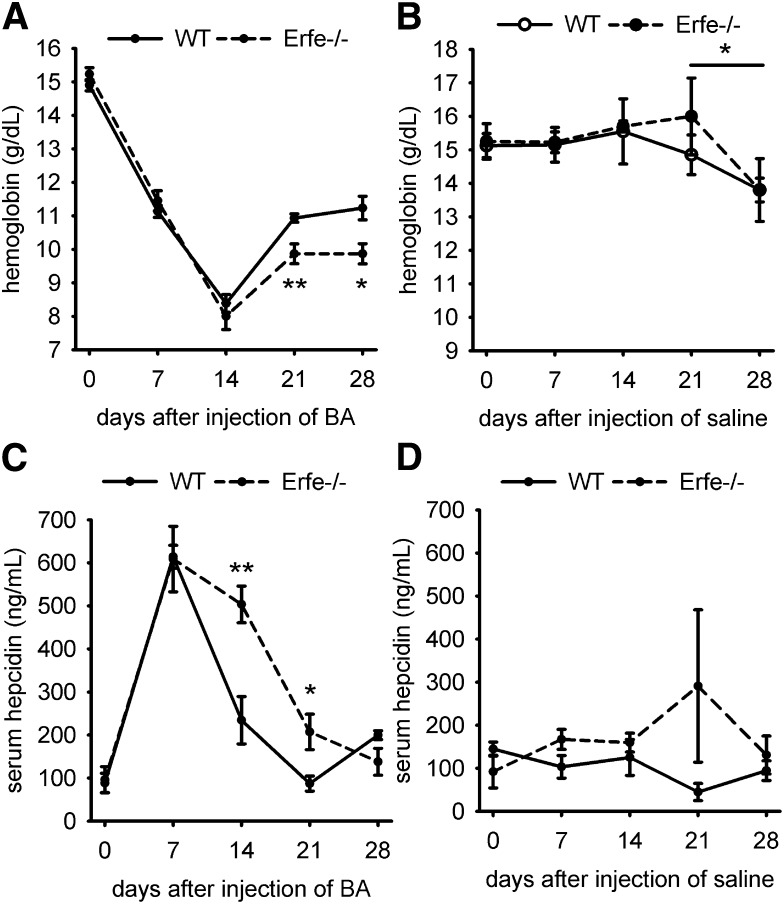
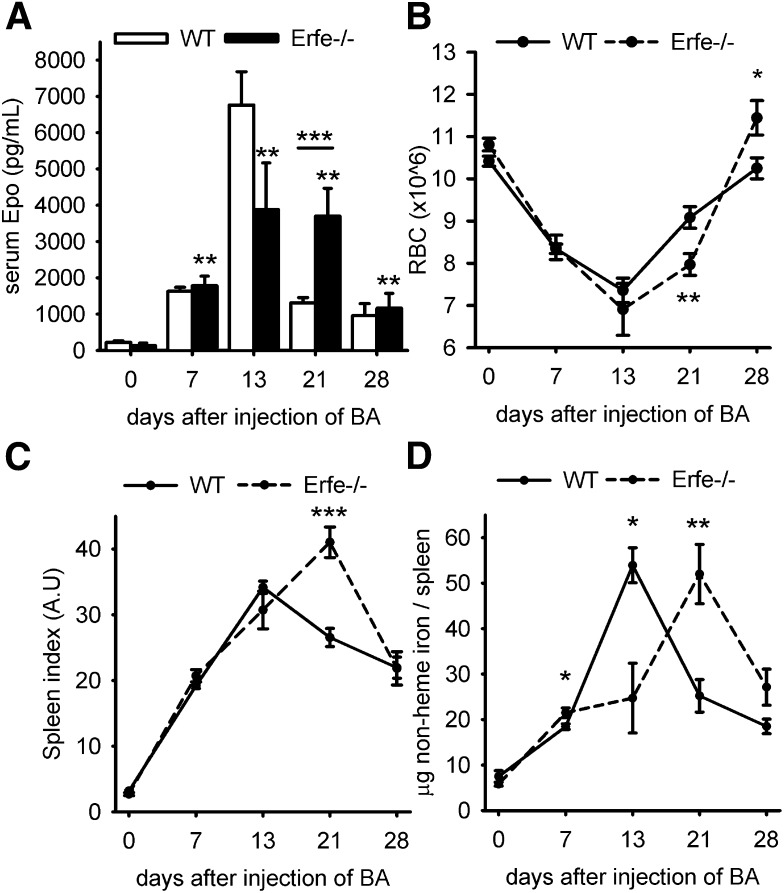
Erythroferrone (ERFE) is an erythropoiesis-driven regulator of iron homeostasis. ERFE mediates the suppression of the iron-regulatory hormone hepcidin to increase iron absorption and mobilization of iron from stores. We examined the role of ERFE in the recovery from anemia of inflammation (AI) induced by injection of heat-killed Brucella abortus. B abortus-treated wild-type mice developed a moderate anemia and reached nadir hemoglobin 14 days after injection and partially recovered by 28 days. We observed that Erfe expression in the bone marrow and the spleen was greatly increased during anemia and peaked at 14 days after injection, a time course similar to serum erythropoietin. To determine whether ERFE facilitates the recovery from anemia, we analyzed Erfe-deficient mice injected with B abortus. Compared with wild-type mice, Erfe-deficient mice exhibited a more severe anemia, had higher hepcidin levels and consequently lower serum iron concentration on days 14 and 21, and manifested impaired mobilization of iron from stores (liver and spleen). Erfe(-/-) mice eventually compensated by further stimulating erythropoiesis and reticulocyte production. Thus, ERFE contributes to the recovery from AI by suppressing hepcidin and increasing iron availability.


Figures

Figure 1
Figure 1
Time-course of serum EPO concentration and ERFE (Fam132b) mRNA expression after injection of heat-killed BA. Serum EPO levels (A) and ERFE mRNA expression in the bone marrow and spleen (B) were elevated by 7 days. Both serum EPO and Erfe mRNA reached a peak at 13 days and remained above baseline for 21 to 28 days. Data shown are means ± SEM and were compared for each time point to values for control mice at t = 0 (n = 6-7 per time point) by 2-tailed Student t test (***P < .001, **P < .01, *P < .05).
Figure 2
Figure 2
Erfe-deficient mice exhibited a more severe AI than WT mice. Hemoglobin (A), hematocrit (B), and MCH (C) were compared between WT and Erfe-deficient mice at t = 0, 7, 13, 21, and 28 days after injection of BA. Erfe−/− mice had lower hemoglobin concentration and lower hematocrit on day 21 than WT mice. MCH was also lower at days 7, 13, 21, and 28 in Erfe−/− mice compared with WT mice. Erfe-deficient mice had higher hepcidin levels 13 days after injection of BA compared with WT mice (D) (see also supplemental Figure 3A). Expression ratios ± SEM of Rpl4-normalized Hamp transcripts in Erfe−/− mice relative to WT controls were calculated using REST. Statistical significance was determined using randomization. Data shown for hemoglobin, hematocrit, and MCH are means ± SEM and were compared between WT and Erfe−/− mice (n = 6-7 per time point) by 2-tailed Student t test at each time point (***P < .001, **P < .01, *P < .05).
Figure 3
Figure 3
Time course of hemoglobin and serum hepcidin concentrations after saline or BA injection in WT and Erfe-deficient mice. Erfe−/− mice had lower hemoglobin concentration than WT mice at 21 and 28 days after injection of BA (A). Repetitive phlebotomies caused a slight decrease in hemoglobin by 28 days in both WT and Erfe−/− mice treated with saline (B). Serum hepcidin concentration was higher on days 14 and 21 after BA injection in Erfe−/− mice compared with WT mice (C) but was unchanged in saline-injected mice (D). Data shown are means ± SEM and were compared for each time point between WT and Erfe−/− mice (n = 6 per time point) by 2-tailed Student t test (**P < .01, *P < .05).
Figure 4
Figure 4
Serum and liver iron concentrations in WT and Erfe-deficient mice after injection of BA. Serum iron concentration was decreased between days 0 and 13 after injection of BA in WT and Erfe−/− mice and was still reduced on day 21 in Erfe−/− mice. Compared with WT mice, Erfe-deficient mice exhibited significantly lower serum iron concentrations on days 13 and 21 (A). Liver iron content (B) was increased during recovery from anemia in WT and Erfe-deficient mice except for WT mice at day 21, where iron levels are similar to day 0. Compared with WT mice, liver iron content was significantly higher in Erfe−/− mice 21 days after infection. Data shown for serum iron concentration (A) and liver iron content (B) are means ± SEM and were compared for each time point to values for control mice at t = 0 (n = 6-7 per time point) by 2-tailed Student t test (***P < .001, **P < .01, *P < .05). Values were also compared at each time point between WT and Erfe−/− mice by 2-tailed Student t test (###P < .001, ##P < .01).
Figure 5
Figure 5
Erfe-deficient mice compensate for hepcidin dysregulation by prolonged erythropoietic stimulation. (A) High EPO concentrations were sustained at 21 days in Erfe-deficient mice (black bars, mean EPO concentration = 3111 pg/mL) compared with WT mice (white bars, mean EPO concentration = 1303 pg/mL, P = .001, shown previously in Figure 1A). Erfe−/− mice had a higher RBC count (B) and spleen index (C) on day 28 than WT mice (spleen index = spleen weight in mg/body weight in g). (D) Nonheme spleen iron content peaked earlier in WT than in Erfe−/− mice. (A) Serum EPO levels are shown as means ± SEM and were compared for each time point to values for control mice at t = 0 (n = 6-7 per time point) by 2-tailed Student t test. Data shown for RBC (B), spleen index (C), and total spleen iron (D) are means ± SEM and were compared between WT and Erfe−/− mice for each time point (n = 6-7 per time point) by 2-tailed Student t test (***P < .001, **P < .01, *P < .05). WT data shown in panel A are identical to those from Figure 1A.
Figure 6
Figure 6
During recovery from BA-induced anemia, Erfe-deficient mice show delayed and more iron-restricted reticulocytosis than WT mice. Absolute reticulocyte count (A) was significantly increased on day 14 only in WT mice, but by day 21, Erfe-deficient mice had higher reticulocyte count than WT mice. Using the forward scatter as an assessment of the reticulocyte size (B), we found that both WT and Erfe−/− mice injected with BA were producing smaller cells than their respective saline controls. Erfe−/− mice produced even smaller reticulocytes than WT at days 14, 21, and 28 (B). Data shown are means ± SEM and were compared for each time point within the same genotype between saline and BA-treated mice by 2-tailed Student t test (*P < .05, ***P < .001). Values were also compared at each time point between WT and Erfe-deficient mice (n = 6 per time point) by 2-tailed Student t test (###P < .001).

Similar articles

Cited by

References

    1. Weiss G, Goodnough LT. Anemia of chronic disease. N Engl J Med. 2005;352(10):1011–1023. - PubMed
    1. Adamson JW. The anemia of inflammation/malignancy: mechanisms and management. Hematology (Am Soc Hematol Educ Program) 2008:159–165. - PubMed
    1. Ganz T. Hepcidin and iron regulation, 10 years later. Blood. 2011;117(17):4425–4433. - PMC - PubMed
    1. Nemeth E, Rivera S, Gabayan V, et al. IL-6 mediates hypoferremia of inflammation by inducing the synthesis of the iron regulatory hormone hepcidin. J Clin Invest. 2004;113(9):1271–1276. - PMC - PubMed
    1. Qiao B, Sugianto P, Fung E, et al. Hepcidin-induced endocytosis of ferroportin is dependent on ferroportin ubiquitination. Cell Metab. 2012;15(6):918–924. - PMC - PubMed

Publication types

MeSH terms