

Template changes with perceptual learning are driven by feature informativeness
- PMID: 25194018
- PMCID: PMC4160004
- DOI: 10.1167/14.11.6
Template changes with perceptual learning are driven by feature informativeness
Abstract
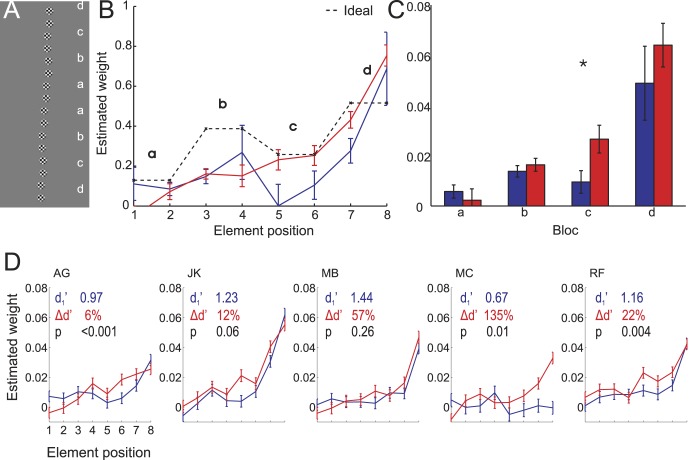
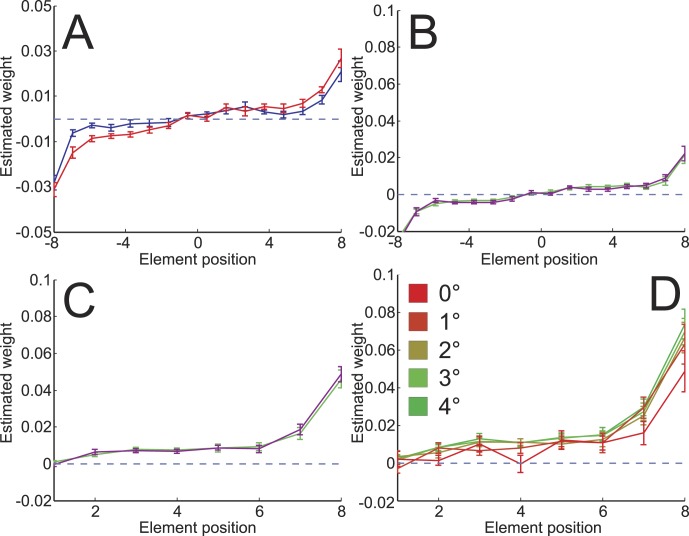
Perceptual learning changes the way the human visual system processes stimulus information. Previous studies have shown that the human brain's weightings of visual information (the perceptual template) become better matched to the optimal weightings. However, the dynamics of the template changes are not well understood. We used the classification image method to investigate whether visual field or stimulus properties govern the dynamics of the changes in the perceptual template. A line orientation discrimination task where highly informative parts were placed in the peripheral visual field was used to test three hypotheses: (1) The template changes are determined by the visual field structure, initially covering stimulus parts closer to the fovea and expanding toward the periphery with learning; (2) the template changes are object centered, starting from the center and expanding toward edges; and (3) the template changes are determined by stimulus information, starting from the most informative parts and expanding to less informative parts. Results show that, initially, the perceptual template contained only the more peripheral, highly informative parts. Learning expanded the template to include less informative parts, resulting in an increase in sampling efficiency. A second experiment interleaved parts with high and low signal-to-noise ratios and showed that template reweighting through learning was restricted to stimulus elements that are spatially contiguous to parts with initial high template weights. The results suggest that the informativeness of features determines how the perceptual template changes with learning. Further, the template expansion is constrained by spatial proximity.
Keywords: classification image; perceptual learning; psychophysics.
© 2014 ARVO.
Figures


Similar articles
-
Template optimization and transfer in perceptual learning.J Vis. 2016 Aug 1;16(10):16. doi: 10.1167/16.10.16. J Vis. 2016. PMID: 27559720
-
Perceptual learning retunes the perceptual template in foveal orientation identification.J Vis. 2004 Feb 6;4(1):44-56. doi: 10.1167/4.1.5. J Vis. 2004. PMID: 14995898
-
Perceptual learning improves efficiency by re-tuning the decision 'template' for position discrimination.Nat Neurosci. 2004 Feb;7(2):178-83. doi: 10.1038/nn1183. Epub 2004 Jan 18. Nat Neurosci. 2004. PMID: 14730311
-
Visual Perceptual Learning and Models.Annu Rev Vis Sci. 2017 Sep 15;3:343-363. doi: 10.1146/annurev-vision-102016-061249. Epub 2017 Jul 19. Annu Rev Vis Sci. 2017. PMID: 28723311 Free PMC article. Review.
-
Auditory perceptual learning and changes in the conceptualization of auditory cortex.Hear Res. 2018 Sep;366:3-16. doi: 10.1016/j.heares.2018.03.011. Epub 2018 Mar 12. Hear Res. 2018. PMID: 29551308 Review.
Cited by
-
Visual Perceptual Learning of Form-Motion Integration: Exploring the Involved Mechanisms with Transfer Effects and the Equivalent Noise Approach.Brain Sci. 2024 Sep 30;14(10):997. doi: 10.3390/brainsci14100997. Brain Sci. 2024. PMID: 39452011 Free PMC article.
-
How musical expertise shapes speech perception: evidence from auditory classification images.Sci Rep. 2015 Sep 24;5:14489. doi: 10.1038/srep14489. Sci Rep. 2015. PMID: 26399909 Free PMC article.
-
A psychophysical imaging method evidencing auditory cue extraction during speech perception: a group analysis of auditory classification images.PLoS One. 2015 Mar 17;10(3):e0118009. doi: 10.1371/journal.pone.0118009. eCollection 2015. PLoS One. 2015. PMID: 25781470 Free PMC article.
-
High-Frequency Sensorineural Hearing Loss Alters Cue-Weighting Strategies for Discriminating Stop Consonants in Noise.Trends Hear. 2019 Jan-Dec;23:2331216519886707. doi: 10.1177/2331216519886707. Trends Hear. 2019. PMID: 31722636 Free PMC article.
-
Visual learning with reduced adaptation is eccentricity-specific.Sci Rep. 2018 Jan 12;8(1):608. doi: 10.1038/s41598-017-18824-7. Sci Rep. 2018. PMID: 29330497 Free PMC article.
References
-
- Abbey C. K., Eckstein M. P., Bochud F. O. (1999). Estimation of human-observer templates in two-alternative forced-choice experiments. Proceedings of SPIE , 3663, 284–295
-
- Abbey C. K., Pham B. T., Shimozaki S. S., Eckstein M. P. (2008). Contrast and stimulus information effects in rapid learning of a visual task. Journal of Vision , 8 (2): 6 1–14, http://www.journalofvision.org/content/8/2/8, doi:10.1167/8.2.8. [PubMed] [Article] - PubMed
-
- Adini Y., Sagi D., Tsodyks M. (2002). Context-enabled learning in the human visual system. Nature , 415, 790–793 - PubMed
-
- Ahissar M., Hochstein S. (2000). The spread of attention and learning in feature search: Effects of target distribution and task difficulty. Vision Research , 40, 1349–1364 - PubMed
Publication types
MeSH terms
Grants and funding
LinkOut - more resources
Full Text Sources
Other Literature Sources
