. 2014 Oct;15(10):920-8.
doi: 10.1038/ni.2986. Epub 2014 Sep 7.

Diversification of TAM receptor tyrosine kinase function

Affiliations

Diversification of TAM receptor tyrosine kinase function

Anna Zagórska et al. Nat Immunol. 2014 Oct.

Abstract

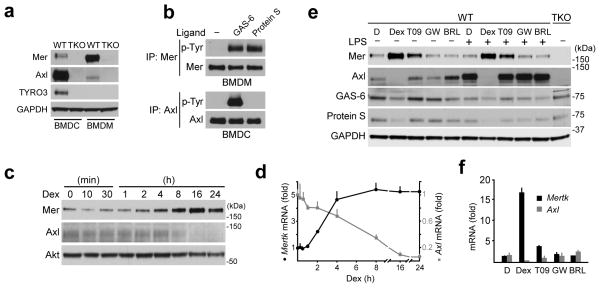
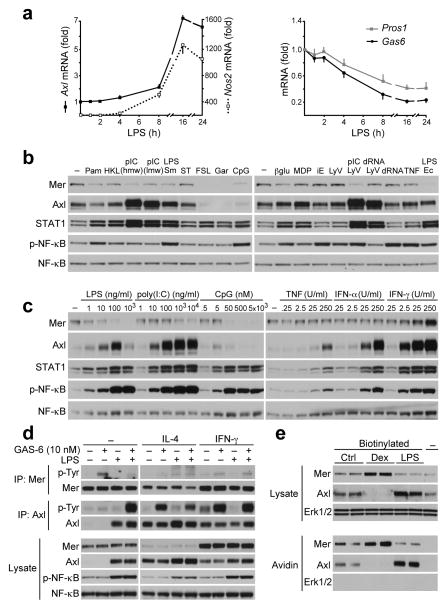
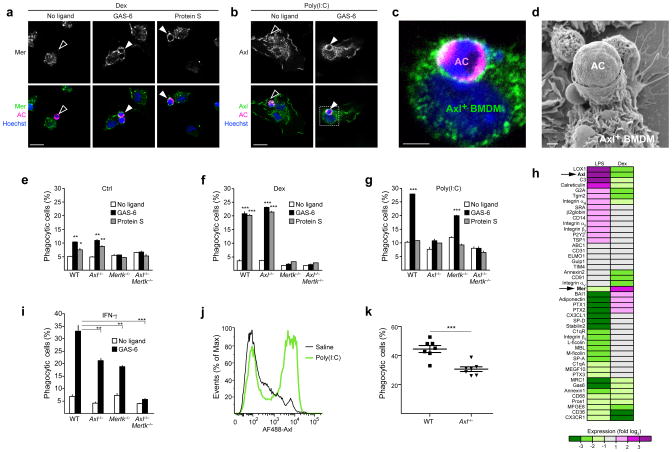
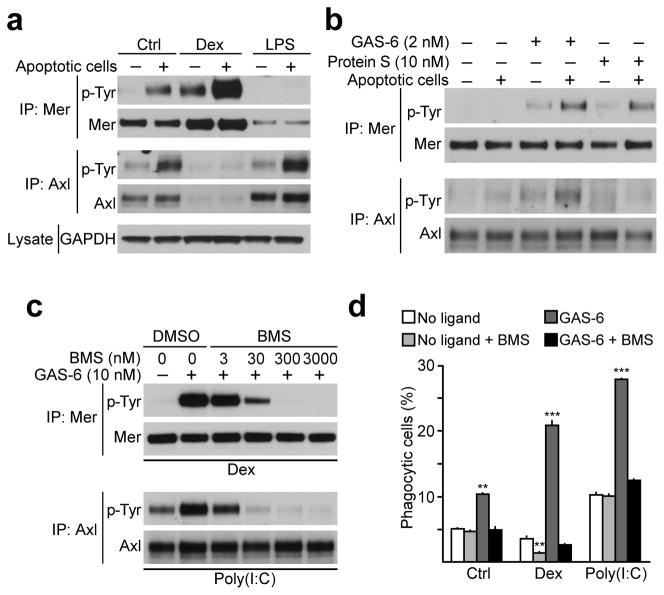
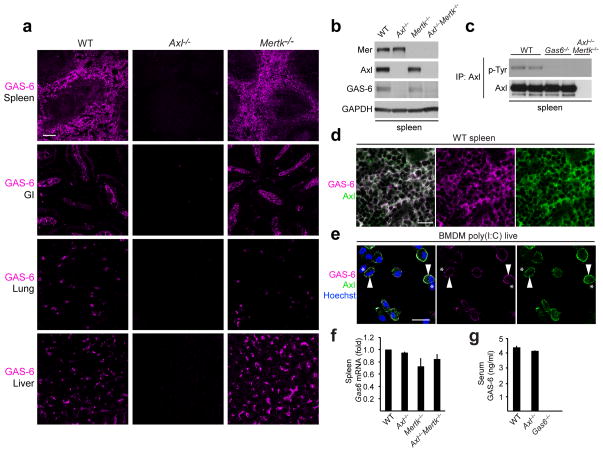
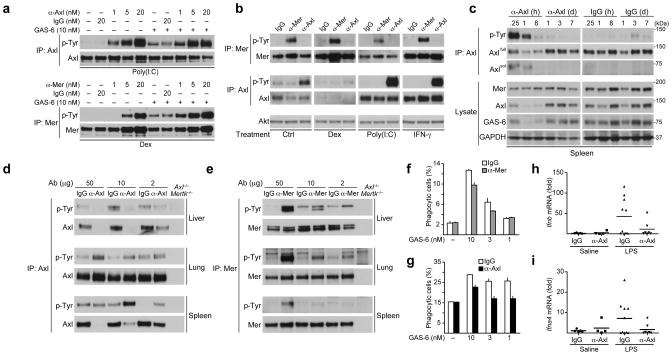
The clearance of apoptotic cells is critical for both tissue homeostasis and the resolution of inflammation. We found that the TAM receptor tyrosine kinases Axl and Mer had distinct roles as phagocytic receptors in these two settings, in which they exhibited divergent expression, regulation and activity. Mer acted as a tolerogenic receptor in resting macrophages and during immunosuppression. In contrast, Axl was an inflammatory response receptor whose expression was induced by proinflammatory stimuli. Axl and Mer differed in their ligand specificities, ligand-receptor complex formation in tissues, and receptor shedding upon activation. These differences notwithstanding, phagocytosis by either protein was strictly dependent on receptor activation triggered by bridging of TAM receptor-ligand complexes to the 'eat-me' signal phosphatidylserine on the surface of apoptotic cells.


Conflict of interest statement

COMPETING FINANCIAL INTERESTS

G.L. is a shareholder in Kolltan Pharmaceuticals.

Figures

Fig. 1
Fig. 1. Differential expression and activation of Axl and Mer
(a) Immunoblot showing TAM receptor expression and antibody specificity in BMDC and BMDM cultures from WT and TAM TKO mice. The exposure of the Axl and Mer immunoblots in this panel is longer than in subsequent figures to visualize the very low expression of Mer in BMDCs and Axl in BMDMs. Representative of two independent experiments. Axl mRNA copy number (per ng of total RNA ± s.d.) was 29±4 and 28±9 in BMDC and BMDM cultures, respectively, suggesting that most of the difference between these cells is post-transcriptional; whereas for Mer mRNA, these numbers were 3±1 and 37±6 in BMDC and BMDM cultures, respectively. (b) BMDM and BMDC cultures were stimulated with 10 nM GAS-6 or 25 nM Protein S for 10 min and receptor activation was assayed by immunoprecipitation and immunoblotting. Representative of three independent experiments. (c,d) Time course of Mer and Axl protein (c) and mRNA (d) in BMDM cultures upon 0.1 μM Dex stimulation assayed by immunoblotting (c) or RT-qPCR (d). (c) – representative of two independent experiments; (d) – fold of change normalized to Hprt mRNA. Average of two independent experiments, each done in technical duplicates, graphed as mean ± s.d. (e,f) Expression of Mer and Axl protein (e - immunoblot) and mRNA (f - RT-qPCR) in BMDM cultures upon 24 h stimulation with nuclear receptor agonists: DMSO (D), 1 μM Dex (Dex), 1 μM T0901317 (T09), 0.2 μM GW501516 (GW), or 1 μM BRL49653 (BRL). 30 ng/ml LPS was added where indicated 8 h before lysis. (e) – representative of two independent experiments; (f) – fold of change relative to Hprt mRNA. Average of two independent experiments, each done in technical duplicates, graphed as mean ± s.d.
Fig. 2
Fig. 2. Axl and Mer expression in inflammatory macrophages
(a) Time course of Axl, Nos2, Gas6 and Pros1 mRNA expression in BMDM cultures in response to 100 ng/ml LPS measured by RT-qPCR. There was virtually no basal expression of Nos2 mRNA prior to stimulation. Data are presented as fold of change normalized to Hprt mRNA. Average of two independent experiments, each done in technical duplicates, graphed as mean ± s.d. (b) Immunoblot showing Mer and Axl protein expression in cell lysates from BMDMs stimulated for 18 h with 100 ng/ml Pam3CSK4 (TLR1/2 ligand), 2×10⁷ cells/ml HKLM (TLR2 ligand), 1 μg/ml poly(I:C) (pIC) high molecular weight (hmw) or low molecular weight (lmw) (TLR3 ligands), 100 ng/ml LPS from Salmonella Minnesota (TLR4 ligand), 100 ng/ml ST-FLA (TLR5 ligand), 100 ng/ml FSL-1 (TLR6/2 ligand), 1 μg/ml gardiquimod (TLR7 ligand), 0.5 μM CpG (ODN1826, TLR9 ligand), 1 μM β-glucan (Dectin ligand), 10 μg/ml MDP (NOD2 ligand), 10 μg/ml iE-DAP (NOD1 ligand), Lyo vector (control), 0.5 μg/ml ppp-dsRNA-Lyo vector (RIG-I ligand), 1 μg/ml pIC-Lyo vector (RIG-I and MDA5 ligand), 0.5 μg/ml ppp-dsRNA (control), TNF (25 U/ml), 100 ng/ml LPS from Escherichia coli (TLR4 ligand). STAT1 and pNF-κB (p65) used as activation markers and total NF-κB as lysate loading control here, and in (c) and (d). Representative of two independent experiments. (c) Immunoblot showing Mer and Axl protein expression in BMDM stimulated for 18 h with indicated concentration of LPS, poly(I:C), CpG, TNF, IFN-α or IFN-γ. Representative of two independent experiments. (d) BMDM cultures were treated for 18 h with 4 ng/ml IL-4 or 25 U/ml IFN-γ with or without 100 ng/ml LPS and then stimulated for 10 min with 10 nM GAS-6. Receptor abundance and activation were monitored by receptor immunoprecipitation (IP) and anti-phosphotyrosine (p-Tyr) immunoblotting, as indicated. Representative of two independent experiments. (e) BMDM cultures were treated for 18 h with 0.1 μM Dex or 100 ng/ml LPS and biotinylated prior to cell lysis. Axl and Mer presence on cell surface were analyzed in avidin pull downs. Representative of three independent experiments.
Fig. 3
Fig. 3. Axl is a phagocytic receptor in activated macrophages
(ad) BMDM cultures were treated with 0.1 μM Dex (a) or 10 μg/ml poly(I:C) (bd) for 24 h and then fed with apoptotic cells (AC) stained with Cell Tracker Orange for 30 min in the presence or absence of the indicated TAM ligands. Cells were fixed and immunostained for Mer (a), Axl (b,c) or visualized by SEM (d). Open arrows: non-engulfed apoptotic cells attached to TAM-negative membrane; closed arrows: engulfed apoptotic cells surrounded by TAM-positive membrane; bars- 20 μm (a and b), 5 μm (c), 1 μm (d). Images are representative of n=10 images per each condition from two independent experiments. (eg,i) BMDM cultures derived from indicated knock-out mice were untreated (Ctrl) (e) or treated for 24 h with 0.1 μM Dex (f), 10 μg/ml poly(I:C) (g) or 250 U/ml IFN-γ (i) and then incubated for 1 h with pHrodo-labeled apoptotic cells with or without indicated TAM ligands. Percent of phagocytosis was measured using flow cytometry (see Online Methods). Data are presented as mean ± s.d. from two independent experiments, each done for duplicate cultures for each genotype and each condition. The statistical significance was analyzed by unpaired two-tailed t-test and is indicated for *p<0.05, **p<0.01 and ***p<0.001. (h) BMDMs were untreated or treated for 24 h with 0.1 μM Dex or 100 ng/ml LPS. Expression of indicated genes was analyzed by RT-qPCR. For each transcript expression was normalized to Cyclophilin A mRNA and fold-change, relative to untreated cells, was calculated. Heat-map represents log2 of fold of change; average of 3 independent experiments. Statistical significance cutoff value for each gene was p<0.05, analyzed by two-tailed t-test. (j) WT mice were injected intraperitoneally with saline or 100 μg poly(I:C). After 16 h peritoneal lavages were collected and Axl expression on CD11b+ peritoneal macrophages was measured by flow cytometry. Plot is representative from n=3 mice for each condition. (k) WT (n=7) or Axl−/− (n=7) mice were injected intraperitoneally with 100 μg poly(I:C). After 16 h mice were injected with pHrodo-labeled apoptotic cells for 1 h followed by the peritoneal lavage collection. Percent of phagocytic CD11b+ macrophages was measured by flow cytometry. Each mouse is presented as a separate data point and mean ± s.e.m are indicated. Data is pooled from two independent experiments. Statistical significance was analyzed by two-tailed t-test; p=0.0004.
Fig. 4
Fig. 4. Axl and Mer kinase activity is necessary for apoptotic cell phagocytosis
(a) BMDM cultures were stimulated for 18 h with 0.1 μM Dex or 100 ng/ml LPS and then incubated with apoptotic cells in 1:10 ratio for 30 min. Receptor activation was assayed by immunoprecipitation and anti-p-Tyr immunoblotting. Representative of two independent experiments. (b) BMDM cultures were starved for 18 h, washed and then stimulated for 10 min with 2 nM GAS-6 or 10 nM Protein S with or without apoptotic cells. Representative of two independent experiments. (c) BMDM cultures were cultured for 18 h with 0.1 μM Dex or 10 μg/ml poly(I:C), pretreated for 15 min with indicated concentration of BMS-777607 and then stimulated for 10 min with 10 nM GAS-6. Receptor activation assayed as in (a). Representative of two independent experiments. (d) BMDM cultures were untreated or treated for 24 h with 0.1 μM Dex or 10 μg/ml poly(I:C) and then incubated for 1 h with pHrodo-labeled apoptotic cells with or without 10 nM GAS-6 and 300 nM BMS-777607 compound. Percent phagocytosis was measured using flow cytometry. Data are presented as mean ± s.d. from two independent experiments, each done for duplicate cultures for each condition. The statistical significance was analyzed by unpaired two-tailed t-test and is indicated for **p<0.01 and ***p<0.001.
Fig. 5
Fig. 5. GAS-6 is bound to Axl in vivo and in vitro
(a) GAS-6 immunohistochemistry in spleen, duodenum (GI), lung and liver sections from indicated mice. Bar, 100 μm. Representative sections from n=3 mice for each genotype. (b) Immunoblot of Axl, Mer and GAS-6 protein in spleen extracts from indicated mice. Representative of two independent experiments. (c) Basal Axl activation in spleen of indicated mice assayed by immunoprecipitation and immunoblotting. Each lane is a separate mouse. Representative of two independent experiments. (d) Co-localization of Axl and GAS-6 in spleen red pulp. Bar, 20 μm. Representative sections from n=3 mice. Axl−/− and Gas6−/− mice were used to verify antibody specificity (not shown). (e) Co-localization of Axl and GAS-6 on the surface of poly(I:C)-treated live BMDMs. Arrowheads: cells co-stained with Axl and GAS-6; asterisks: cells negative for both Axl and GAS-6. Bar, 20 μm. Representative of two independent experiments. Cells from Axl−/− and Gas6−/− mice were used to verify antibody specificity (not shown). (f) RT-qPCR of Gas6 mRNA in spleen from indicated mice. Average of n=2 mice for each genotype, normalized to Actin mRNA and graphed as mean fold of change ± s.d. (g) GAS-6 protein in serum from indicated mice, measured by ELISA. Average of n=3 mice for each genotype graphed as mean ± s.d.
Fig. 6
Fig. 6. Axl- and Mer-activating antibodies
(a) BMDM cultures were pre-treated with 0.1 μM Dex or 10 μg/ml poly(I:C) for 18 h, and then stimulated with control antibody, α-Axl or α-Mer activating antibody for 20 min, with or without addition of 10 nM GAS-6 for the final 10 min. Receptor activation was assayed by immunoprecipitation and immunoblotting. Representative of two independent experiments. (b) BMDM cultures were pretreated for 18 h with 0.1 μM Dex, 10 μg/ml poly(I:C) or 250 U/ml IFN-γ and then stimulated for 10 min with 10 nM of the indicated activating antibody. Representative of two independent experiments. (c) Mice were injected IV with 10 μg of α-Axl antibody or control IgG, and spleens were collected at the indicated time points. Axl receptor phosphorylation was assayed by immunoprecipitation and immunoblotting. GAS-6 presence was assayed by immunoblotting of total spleen lysates. Representative of two independent experiments. (d,e) Mice were injected IV with indicated dose of α-Axl or control IgG (d) or α-Mer or control IgG (e) for 1 h. Axl and Mer receptor phosphorylation was assayed by immunoprecipitation and immunoblotting. Representative of two independent experiments. (f,g) BMDM cultures were pretreated for 24 h with 0.1 μM Dex (f) or 10 μg/ml poly(I:C) (g) and the phagocytosis assay was performed in the presence of 10 nM α-Mer (f) or α-Axl (g) activating antibody and indicated concentrations of GAS-6. Data is presented as mean ± s.d. from two independent experiments, each done for duplicate cultures for each condition. (h,i) WT mice were injected IP with saline or 10 μg LPS together with 10 μg of either control IgG or α-Axl activating antibody. Ifnb (h) and Ifna4 (i) induction in spleen was measured by RT-qPCR relative to Cyclophilin A expression and presented as fold of change. Each mouse is plotted as a separate data point. Mean is indicated. n=5 (saline IgG), n=4 (saline α-Axl), n=10 (LPS IgG), n=7 (LPS α-Axl),

Comment in

  • Immune signalling: Waste sorting.
    Bordon Y. Bordon Y. Nat Rev Immunol. 2014 Oct;14(10):651. doi: 10.1038/nri3746. Epub 2014 Sep 19. Nat Rev Immunol. 2014. PMID: 25234147 No abstract available.

References

    1. Munoz LE, Lauber K, Schiller M, Manfredi AA, Herrmann M. The role of defective clearance of apoptotic cells in systemic autoimmunity. Nat Rev Rheumatol. 2010;6:280–289. - PubMed
    1. Lemke G. Biology of the TAM receptors. Cold Spring Harbor Perspectives. 2013;5(11) doi: 10.1101/cshperspect.a009076. - DOI - PMC - PubMed
    1. Lemke G, Rothlin CV. Immunobiology of the TAM receptors. Nat Rev Immunol. 2008;8:327–336. - PMC - PubMed
    1. Lu Q, Lemke G. Homeostatic regulation of the immune system by receptor tyrosine kinases of the Tyro 3 family. Science. 2001;293:306–311. - PubMed
    1. Rothlin CV, Ghosh S, Zuniga EI, Oldstone MB, Lemke G. TAM receptors are pleiotropic inhibitors of the innate immune response. Cell. 2007;131:1124–1136. - PubMed

Publication types

MeSH terms

Substances