. 2014 Oct;21(10):893-900.
doi: 10.1038/nsmb.2886. Epub 2014 Sep 7.

Protein dynamics during presynaptic-complex assembly on individual single-stranded DNA molecules

Affiliations

Protein dynamics during presynaptic-complex assembly on individual single-stranded DNA molecules

Bryan Gibb et al. Nat Struct Mol Biol. 2014 Oct.

Abstract

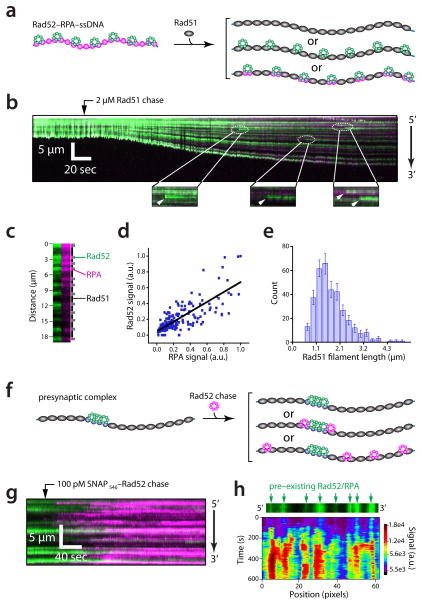
Homologous recombination is a conserved pathway for repairing double-stranded breaks, which are processed to yield single-stranded DNA overhangs that serve as platforms for presynaptic-complex assembly. Here we use single-molecule imaging to reveal the interplay between Saccharomyces cerevisiae RPA, Rad52 and Rad51 during presynaptic-complex assembly. We show that Rad52 binds RPA-ssDNA and suppresses RPA turnover, highlighting an unanticipated regulatory influence on protein dynamics. Rad51 binding extends the ssDNA, and Rad52-RPA clusters remain interspersed along the presynaptic complex. These clusters promote additional binding of RPA and Rad52. Our work illustrates the spatial and temporal progression of the association of RPA and Rad52 with the presynaptic complex and reveals a new RPA-Rad52-Rad51-ssDNA intermediate, with implications for how the activities of Rad52 and RPA are coordinated with Rad51 during the later stages of recombination.


Conflict of interest statement

Competing Financial Interests

The authors declare no competing financial interests.

Figures

Fig. 1
Fig. 1
Single–stranded DNA curtain assay for presynaptic complex assembly. (a) Schematic of ssDNA curtains. (b) Wide–field images of RPA–mCherry (magenta) bound to ssDNA in the absence (upper panel) and presence of 50 pM SNAP488–Rad52 (green; lower panel). (c) Wide–field images of 50 pM SNAP488–Rad52 (upper panel) or 1 nM SNAP488–Rad52 (lower panels) bound to wild–type (unlabeled) RPA on ssDNA. The 5′→3′ orientation of the ssDNA is indicated in this and all subsequent figures.
Fig. 2
Fig. 2
Individual Rad52 complexes binding to RPA–ssDNA. (a) Kymographs showing the association of single SNAP488–Rad52 (50 pM) complexes with RPA–mCherry–ssDNA or (b) wt (dark) RPA–ssDNA. (c) Kymograph confirming that SNAP488–Rad52 does not associate with a control surface lacking an ssDNA molecule. (d) Example of Rad52 bound to an RPA–ssDNA complex highlighting that RPA is not selectively lost from sites bound by Rad52. (e) Histogram showing the uniform intensity distribution for individual SNAP–tagged Rad52 complexes bound to RPA–ssDNA (n = 591). (f)Distribution of Rad52 nucleation sites along the length of the RPA–ssDNA (n = 498). Error bars represent the standard deviation (s.d.) from n bootstrap samples.
Fig. 3
Fig. 3
Nucleation and growth of Rad52 on RPA–ssDNA. (a) Schematic illustration of two–color pulse–chase experiment used to determine spatial distribution of new Rad52 binding events relative to pre–existing Rad52 complexes (b) Kymograph showing the binding of SNAP546–Rad52 to a RPA–ssDNA molecule already bound to SNAP488–Rad52. (c) Correlation of normalized SNAP488–Rad52 and SNAP546–Rad52 signals (n = 262). (d) Relative number of co–localized Rad52 binding events compared to binding events at new (novel) sites on the RPA–ssDNA. (e) Potential models for Rad52 nucleation and growth. (f) Integrated SNAP488–Rad52 (625 pM) signal across entire ssDNA molecules over time. (g) Kymographs highlighting the nucleation and bidirectional growth of Rad52 (625 pM) along the RPA–ssDNA. Arrowheads (f) & (g) indicate when initial nucleation events are visually detected in the kymographs, and these are also defined as the zero time point in (f).
Fig. 4
Fig. 4
Rad52 regulates RPA turnover. (a) Schematic for determining Rad52 binding lifetime on RPA–ssDNA. (b) Kymographs showing SNAP488–Rad52 dissociation over 10–minutes (upper panel) or 2–hours (lower panel); shuttering time was adjusted so that the total illumination time was identical for both experimental measurements . (c) Models for the potential influence of Rad52 on RPA turnover. (d) RPA–mCherry turnover after chasing with wt RPA, ±1 nM SNAP488–Rad52. Aligned images of ssDNA molecules showing persistent co–localization of SNAP488–Rad52 and RPA–mCherry clusters. (e) Examples showing quantitation of RPA–mCherry turnover on single ssDNA molecules. (f) Aligned images of RPA–mCherry and SNAP488–Rad52 on different ssDNA molecules. (g) Line graphs of SNAP488–Rad52 and RPA–mCherry co–localization. (h) Correlation analysis of RPA–mCherry and SNAP488–Rad52 after exchange with wt RPA (n = 255).
Fig. 5
Fig. 5
Protein dynamics during presynaptic complex assembly. (a) Schematic illustration showing examples of the potential influence of Rad51 filament assembly on Rad52 bound to RPA–ssDNA. (b)Kymograph of wild–type (unlabeled) Rad51 (1 μM)binding to Rad52–RPA–ssDNA complexes containing RPA–mCherry and SNAP488–Rad52 in the presence of ATP (2.5 mM); new Rad52 binding events are highlighted. (c)Example of the spatial distribution of RPA (magenta), Rad52 (green), and Rad51 (dark) on a single ssDNA molecule. (d)Correlation analysis of RPA–mCherry and SNAP488–Rad52 within the Rad51 presynaptic filaments (n = 187). (e) Rad51 filament length distribution; filament length is defined as the distances between adjacent Rad52–RPA clusters (n = 346). Error bars represent the standard deviation (s.d.) from n bootstrap samples.(f) Two–color experiment for testing whether newly added Rad52 can bind the presynaptic filaments. (g) Kymograph showing SNAP546–Rad52 re–binding to a presynaptic filament. (h) Spatially distinct re–binding kinetics of SNAP546–Rad52 to a presynaptic complex.
Fig. 6
Fig. 6
Assembly of Rad51–Rad52–RPA–ssDNA presynaptic intermediates. (a) Experimental schematic for detecting Rad52 and RPA binding to a pre–assembled Rad51–Rad52–RPA–ssDNA complex. (b) Kymographs showing wild-type Rad51 filament assembly on Rad52–RPA–ssDNA, followed by co–injection of additional Rad52 and RPA (as indicated). The upper panel shows a two–color overlay, and the lower panels show the individual red and green channels, as indicated. (c) & (d) show the spatially distinct binding kinetics of newly added RPA and Rad52, respectively, along the lengths of the pre–assembled Rad51–Rad52–RPA–ssDNA presynaptic filament. Arrowheads indicate the locations of the pre–existing Rad52–RPA clusters within the Rad51 filaments.
Fig. 7
Fig. 7
Model for RPA and Rad52 dynamics during presynaptic complex assembly. (a) Assembly pathway for the Rad51–Rad52–RPA–ssDNA presynaptic complexes. (b) Influence of Rad52–RPA on strand invasion and second strand capture during the later stages of homologous recombination. Details of the models are presented in the Discussion.

References

    1. Mazon G, Mimitou EP, Symington LS. SnapShot: Homologous recombination in DNA double–strand break repair. Cell. 2010;142:646, 646 e1. - PubMed
    1. San Filippo J, Sung P, Klein H. Mechanism of eukaryotic homologous recombination. Annu Rev Biochem. 2008;77:229–57. - PubMed
    1. Krogh BO, Symington LS. Recombination proteins in yeast. Annu Rev Genet. 2004;38:233–71. - PubMed
    1. Cromie GA, Connelly JC, Leach DR. Recombination at double–strand breaks and DNA ends: conserved mechanisms from phage to humans. Mol Cell. 2001;8:1163–74. - PubMed
    1. Cejka P, et al. DNA end resection by Dna2–Sgs1–RPA and its stimulation by Top3–Rmi1 and Mre11–Rad50–Xrs2. Nature. 2010;467:112–6. - PMC - PubMed

Publication types

MeSH terms

Substances