Randomized Controlled Trial
. 2015 Jan;62(1):190-7.
doi: 10.1016/j.jhep.2014.08.036. Epub 2014 Sep 6.

Effects of n-3 fish oil on metabolic and histological parameters in NASH: a double-blind, randomized, placebo-controlled trial

Affiliations
Randomized Controlled Trial

Effects of n-3 fish oil on metabolic and histological parameters in NASH: a double-blind, randomized, placebo-controlled trial

Curtis K Argo et al. J Hepatol. 2015 Jan.

Abstract

Background & aims: This study's aim was to assess the histological and metabolic effects of n-3 polyunsaturated fatty acids (PUFAs) vs. placebo while adjusting for the impact of age and weight change in NASH patients. (ClinicalTrials.gov: NCT00681408).

Methods: Forty-one subjects with non-cirrhotic NASH were enrolled, and 34 completed the study. 17 received n-3 fish oil 3000 mg/day and 17 received placebo daily for 1 year with typical counselling on caloric intake and physical activity for all subjects.

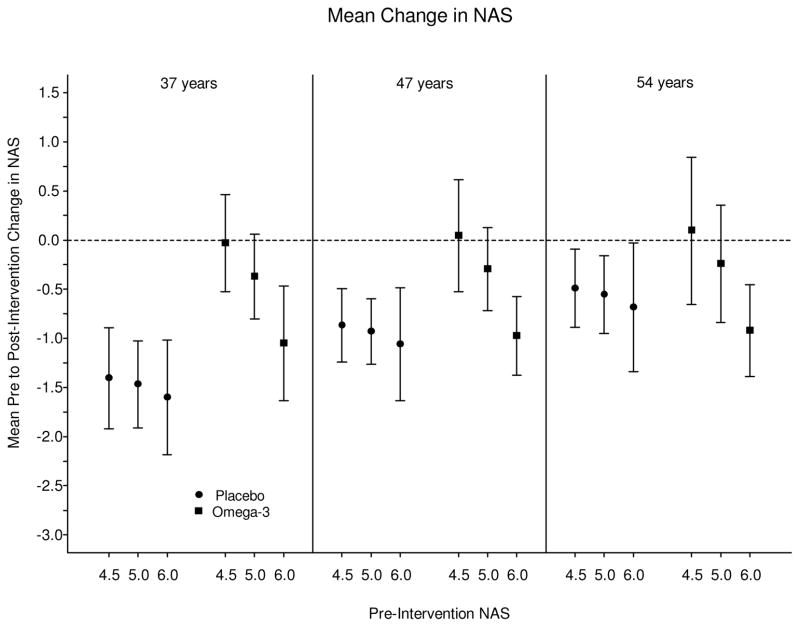
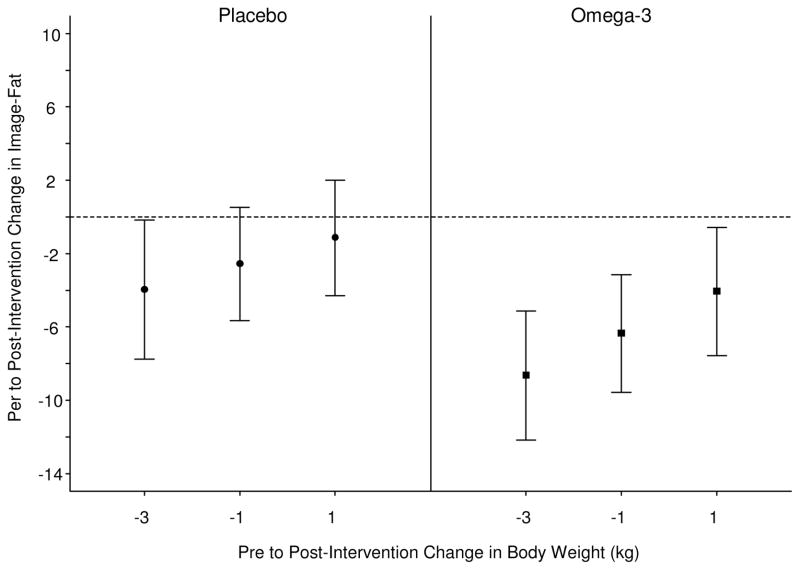
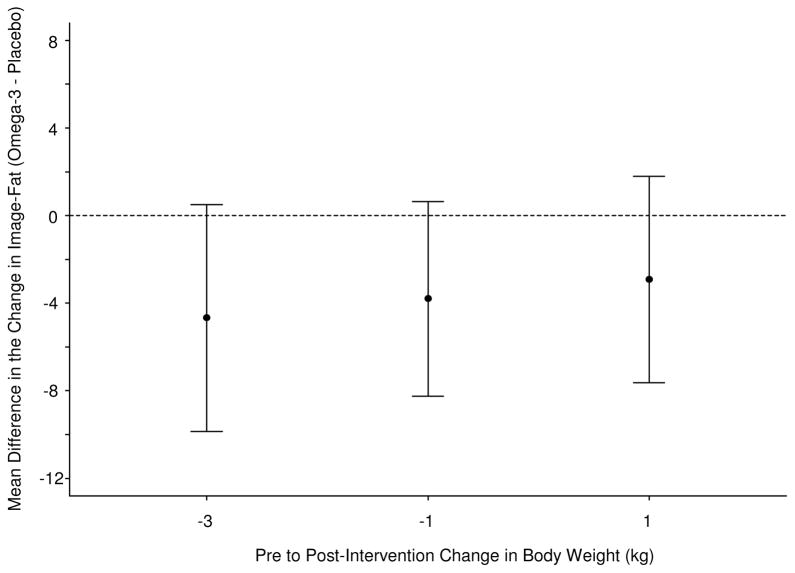
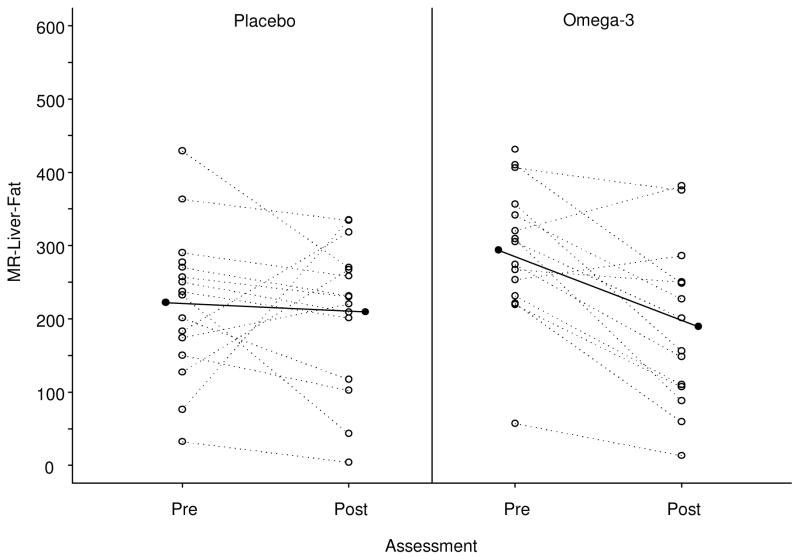
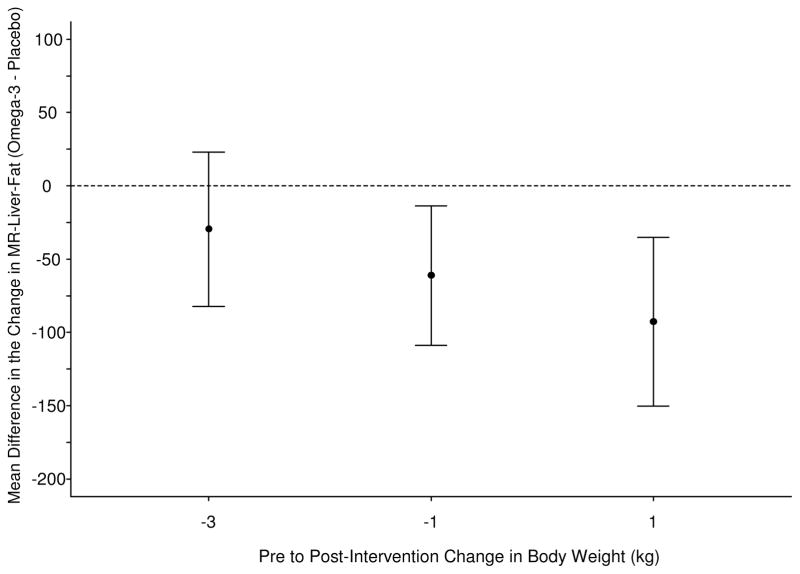
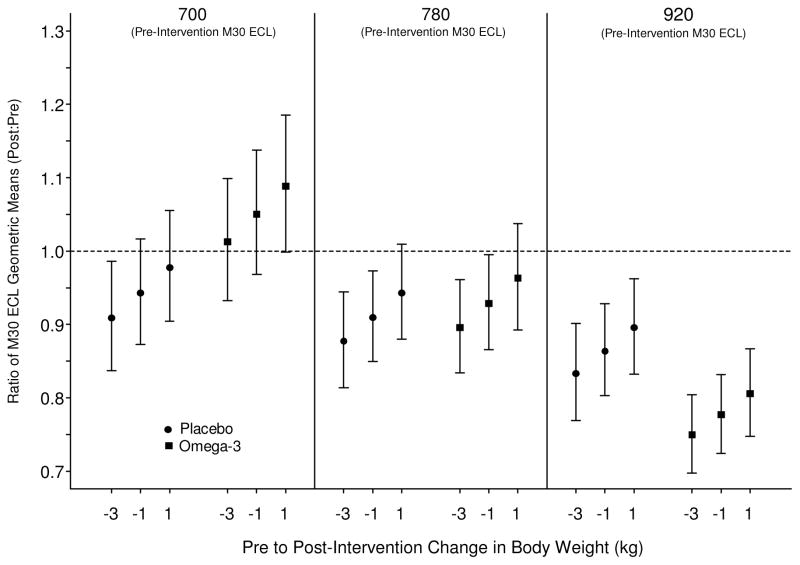
Results: N-3- and placebo-treated groups showed no significant difference for the primary end point of NASH activity score (NAS) reduction ⩾ 2 points without fibrosis progression after adjustment for known covariates (n-3, 4/17 (23.5%); placebo, 3/17, (17.6%), p = 0.99). Among subjects with increased or stable weight, n-3 subjects showed a larger decrease in liver fat content by MRI than placebo-treated subjects (p = 0.014 for 2nd quartile, p = 0.003 for 3rd quartile of weight change). N-3 treatment showed significant fat reduction on the paired analysis of image-assisted fat morphometry regardless of weight loss or gain. Exercise capacity remained markedly reduced in all subjects. No independent effects on markers of hepatocyte injury or insulin sensitivity indices were observed.

Conclusion: N-3 PUFAs at 3000 mg/day for one year did not lead to an improvement in the primary outcome of histological activity in NASH patients (⩾ 2 point NAS reduction). N-3 led to reduced liver fat by multiple measures. Other metabolic effects were not seen, although no detrimental effects were apparent. Whether longer duration, higher dose, or different composition of n-3 therapy would lead to additional benefits is uncertain.

Keywords: Cardiorespiratory fitness; Exercise; Fatty liver; N-3 fatty acid; Obesity; Steatohepatitis.


Conflict of interest statement

Conflict of Interest Statement: The authors do not have any commercial associations that might pose a conflict of interest in connection with the submitted manuscript.

Figures

Figure 1
Figure 1. Mean changes in NAS, stratified by age and baseline NAS score
Overall, there was no difference in change in NAS across the two groups over the study period. There was also no difference in resolution of NASH (NAS < 4 at end-of-study). However, the magnitude of baseline score and age significantly influenced changes in these histological parameters.
Figure 2
Figure 2. Mean change in liver fat assessed by computer-assisted image morphometry of liver biopsy tissue
(A) 95% confidence intervals for the mean pre to post-intervention change in Image-Liver-Fat, evaluated at the 1st, 2nd, and 3rd quartiles of the pre to post-intervention change in body weight (kg) distribution. This figure demonstrates that N-3 intervention led to strong trends in improvement in liver fat by histological image analysis than placebo at the lowest 2 quartiles of weight change. (B) Mean difference in pre to post-intervention change in Image-Liver-fat, between N-3 and placebo evaluated at the 1st, 2nd, and 3rd, quartiles of the pre to post-intervention change in body weight distribution. This figure shows that N-3 intervention led to similar change in Steatosis by image analysis regardless of weight change.
Figure 3
Figure 3. Changes in liver fat assessed by MRI
(A) Scatterplot and trend-line of adjusted MRI liver fat measurements at baseline and end-of-study. N-3 led to significant improvement in liver fat compared to placebo. (B) Mean difference in pre to post-intervention change in MR-Liver-fat, between N-3 and placebo evaluated at the 1st, 2nd, and 3rd, quartiles of the pre to post-intervention change in body weight distribution. N-3 intervention appears to have greater effects in patients with lesser weight loss or weight gain.
Figure 4
Figure 4. Mean changes in M30 serum biomarker
95% confidence intervals for the ratio of M30 ECL geometric means (post-intervention:pre-intervention), evaluated at the 1st, 2nd, and 3rd quartiles of the pre-intervention M30-ECL and Δ body weight distributions. This figure demonstrates the consistent effects of weight loss on M30 and that N-3 intervention resulted in greater positive impact (decrease in Post:Pre M30 ratio on y-axis) at higher baseline M30 levels, which has been linked to increased baseline necroapoptosis.

References

    1. Lazo M, Clark JM. The epidemiology of nonalcoholic fatty liver disease: a global perspective. Semin Liver Dis. 2008;28:339–50. - PubMed
    1. Simopoulos AP. Importance of the omega-6/omega-3 balance in health and disease: evolutionary aspects of diet. World Rev Nutr Diet. 2011;102:10–21. - PubMed
    1. RE: Health Claim Petition: Omega-3 Fatty Acids and Reduced Risk of Coronary Heart Disease (Docket No. 2003Q-0401) Sep 8, 2004. [Accessed on April 19, 2013]. Letter responding to a request to reconsider the qualified claim for a dietary supplement health claim for omega-3 fatty acids and coronary heart disease.
    1. Cortez-Pinto H, Jesus L, Barros H, et al. How different is the dietary pattern in non-alcoholic steatohepatitis patients? Clin Nutr. 2006;25:816–23. - PubMed
    1. Musso G, Gambino R, De Michieli F, et al. Dietary habits and their relations to insulin resistance and postprandial lipemia in nonalcoholic steatohepatitis. Hepatology. 2003;37:909–16. - PubMed

Publication types

Substances

Associated data