

Multi-capillary column-ion mobility spectrometry of volatile metabolites emitted by Saccharomyces cerevisiae
- PMID: 25197771
- PMCID: PMC4192691
- DOI: 10.3390/metabo4030751
Multi-capillary column-ion mobility spectrometry of volatile metabolites emitted by Saccharomyces cerevisiae
Abstract
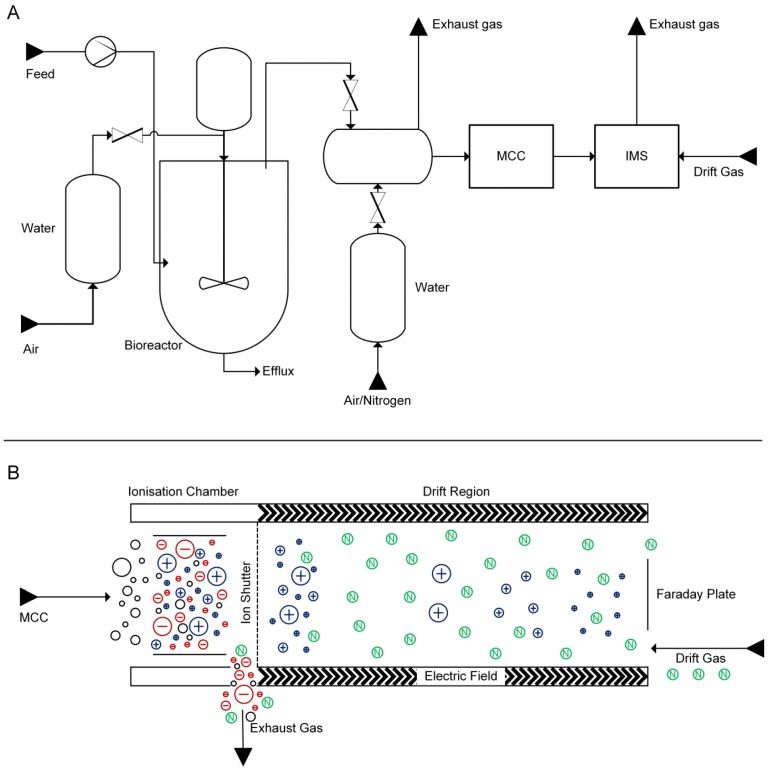
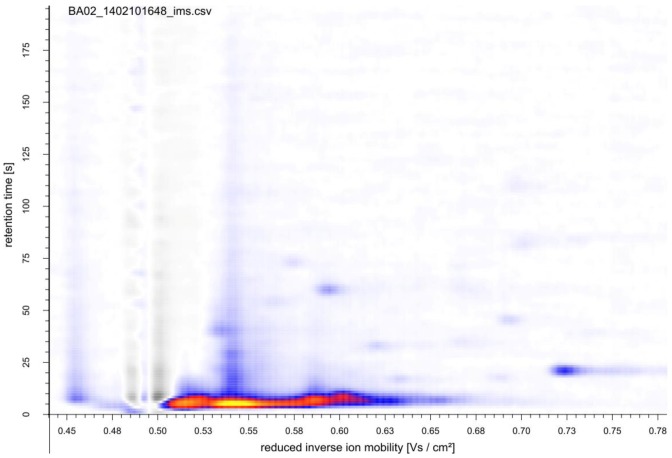
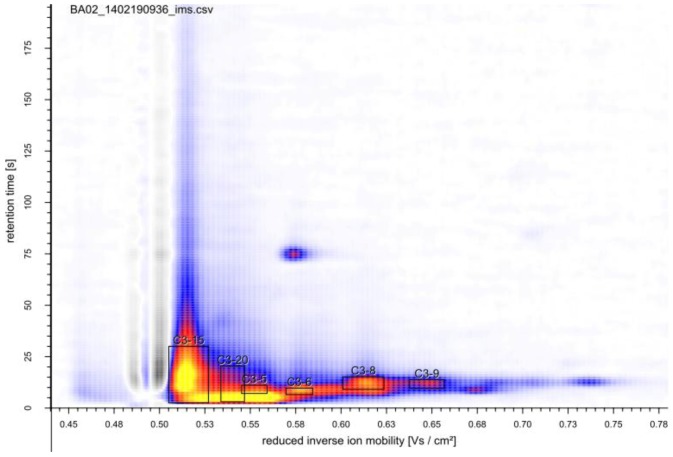
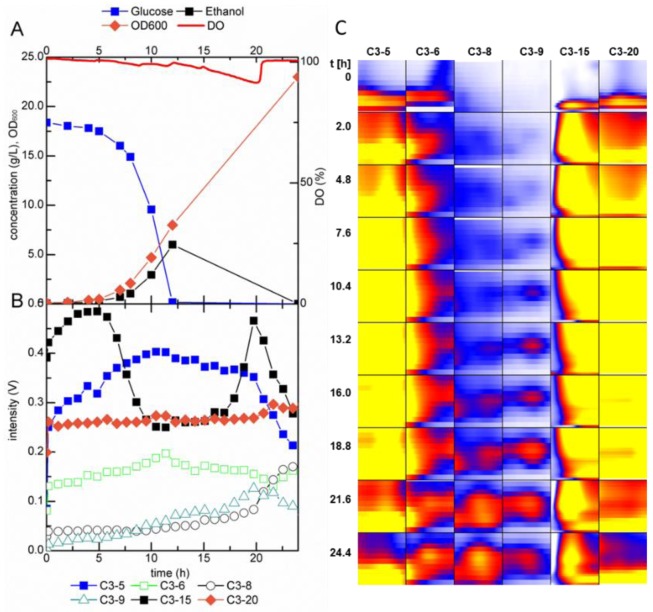
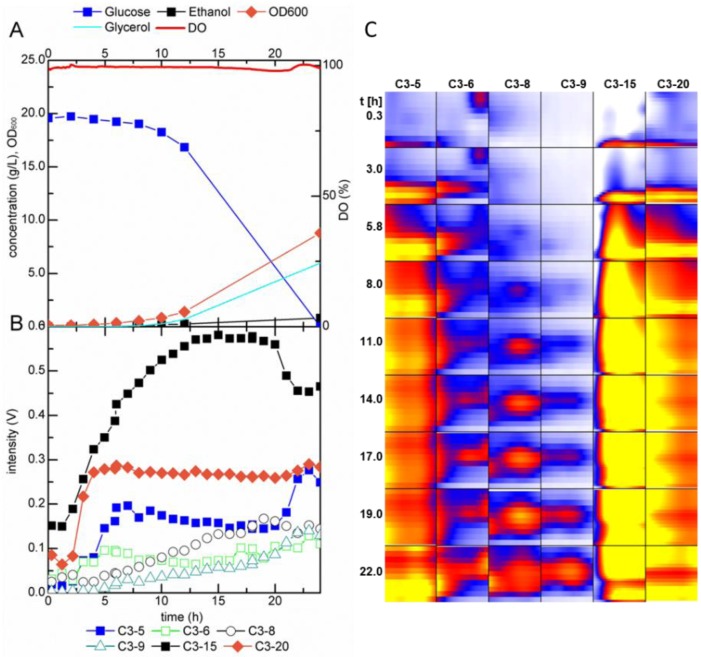
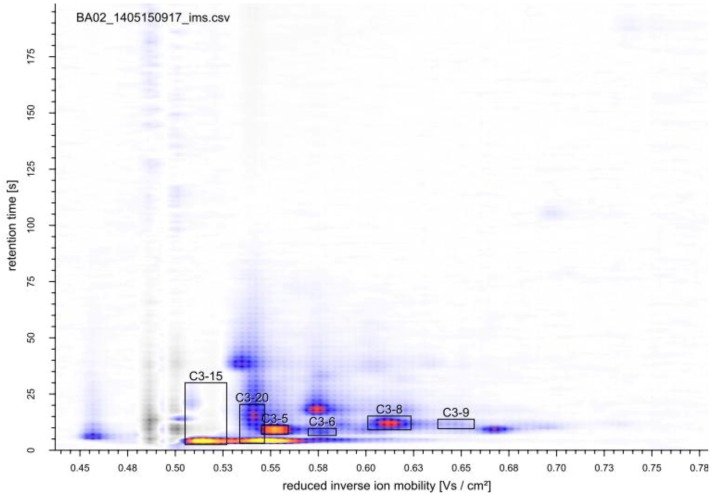
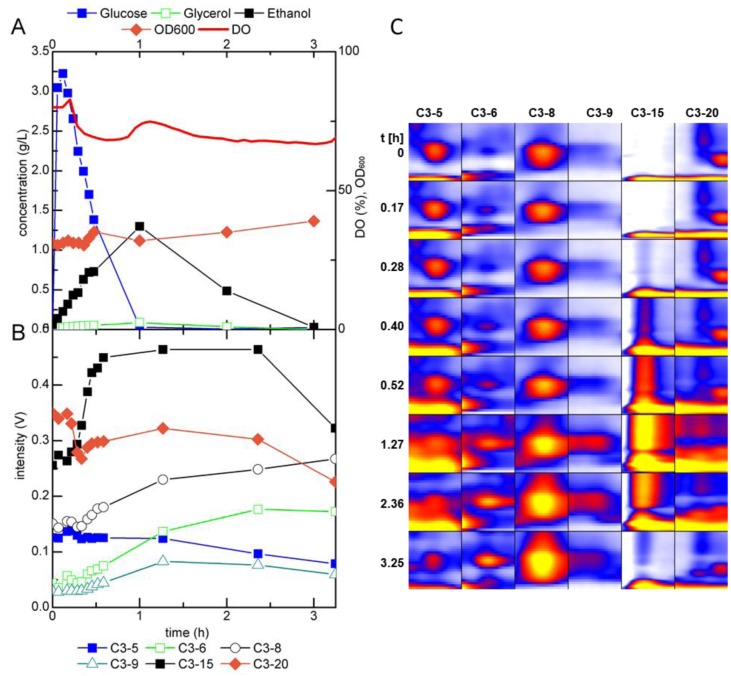
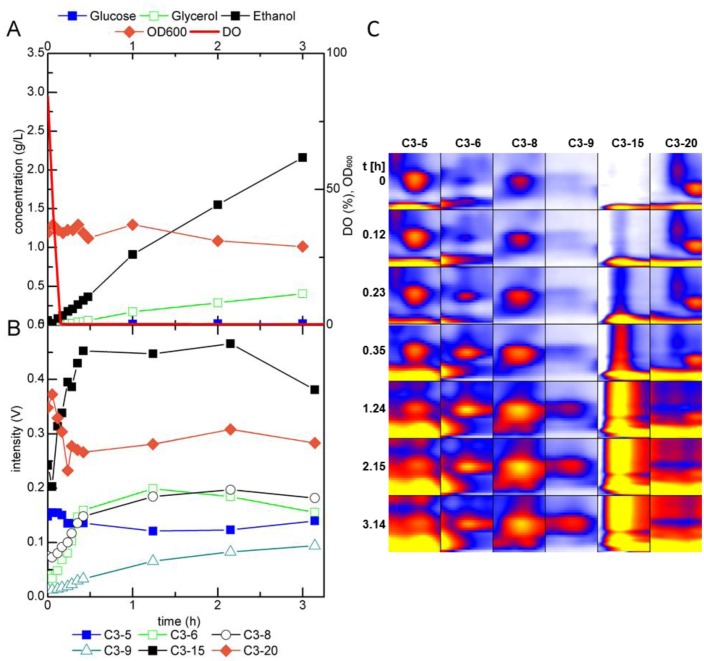
Volatile organic compounds (VOCs) produced during microbial fermentations determine the flavor of fermented food and are of interest for the production of fragrances or food additives. However, the microbial synthesis of these compounds from simple carbon sources has not been well investigated so far. Here, we analyzed the headspace over glucose minimal salt medium cultures of Saccharomyces cerevisiae using multi-capillary column-ion mobility spectrometry (MCC-IMS). The high sensitivity and fast data acquisition of the MCC-IMS enabled online analysis of the fermentation off-gas and 19 specific signals were determined. To four of these volatile compounds, we could assign the metabolites ethanol, 2-pentanone, isobutyric acid, and 2,3-hexanedione by MCC-IMS measurements of pure standards and cross validation with thermal desorption-gas chromatography-mass spectrometry measurements. Despite the huge biochemical knowledge of the biochemistry of the model organism S. cerevisiae, only the biosynthetic pathways for ethanol and isobutyric acid are fully understood, demonstrating the considerable lack of research of volatile metabolites. As monitoring of VOCs produced during microbial fermentations can give valuable insight into the metabolic state of the organism, fast and non-invasive MCC-IMS analyses provide valuable data for process control.
Figures
References
-
- McGovern P.E., Glusker D.L., Exner L.J., Voigt M.M. Neolithic resinated wine. Nature. 1996;381:480–481.
-
- Mortimer R.K. Evolution and variation of the yeast (Saccharomyces) Genome Res. 2000;10:891. - PubMed
-
- Sicard D., Legras J.L. Bread, beer and wine: Yeast domestication in the Saccharomyces sensu stricto complex. Comptes Rendus Biol. 2011;334:229–236. - PubMed
-
- Paddon C.J., Westfall P.J., Pitera D.J., Benjamin K., Fisher K., McPhee D., Leavell M.D., Tai A., Main A., Eng D., et al. High-level semi-synthetic production of the potent antimalarial artemisinin. Nature. 2013;496:528–532. - PubMed
LinkOut - more resources
Full Text Sources
Other Literature Sources
Molecular Biology Databases
Research Materials
