. 2014 Oct 1;37(10):1589-600.
doi: 10.5665/sleep.4064.

Blood-gene expression reveals reduced circadian rhythmicity in individuals resistant to sleep deprivation

Affiliations

Blood-gene expression reveals reduced circadian rhythmicity in individuals resistant to sleep deprivation

Erna S Arnardottir et al. Sleep. .

Abstract

Study objectives: To address whether changes in gene expression in blood cells with sleep loss are different in individuals resistant and sensitive to sleep deprivation.

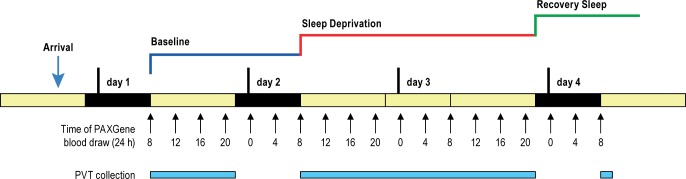
Design: Blood draws every 4 h during a 3-day study: 24-h normal baseline, 38 h of continuous wakefulness and subsequent recovery sleep, for a total of 19 time-points per subject, with every 2-h psychomotor vigilance task (PVT) assessment when awake.

Setting: Sleep laboratory.

Participants: Fourteen subjects who were previously identified as behaviorally resistant (n = 7) or sensitive (n = 7) to sleep deprivation by PVT.

Intervention: Thirty-eight hours of continuous wakefulness.

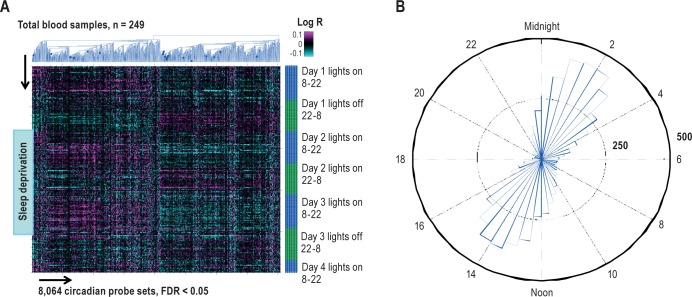
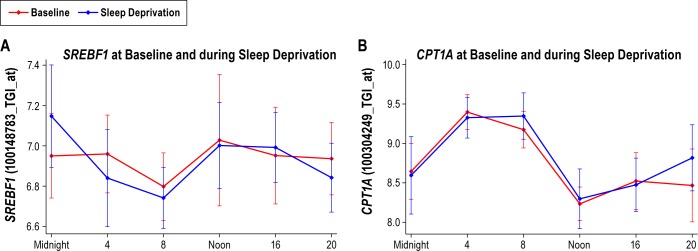
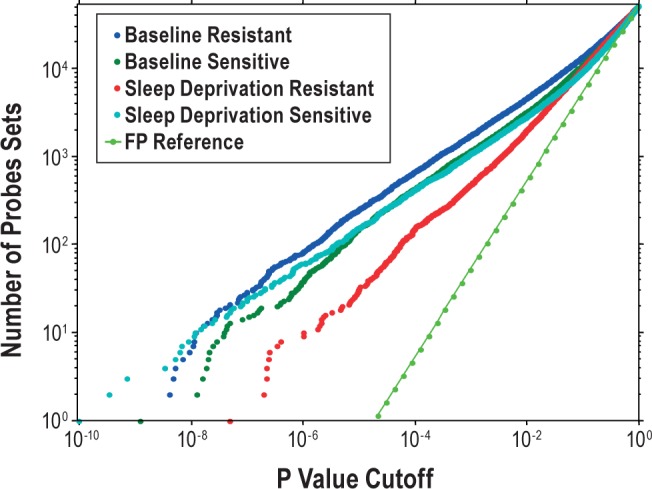
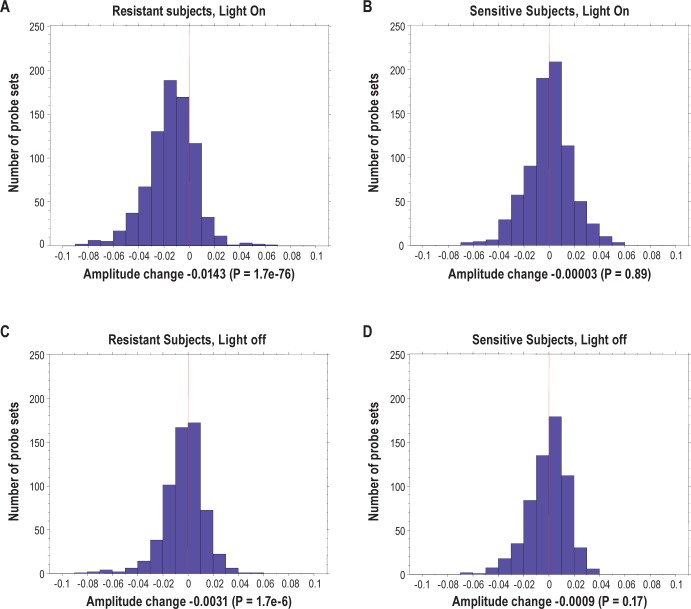
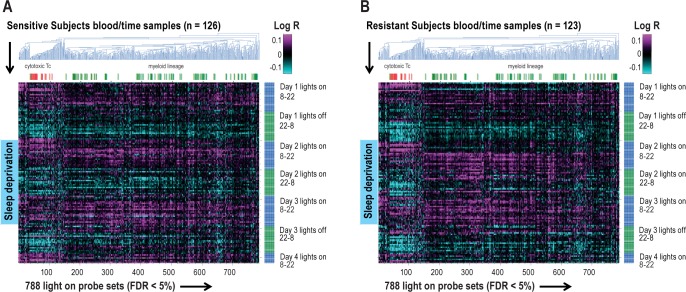
Measurements and results: We found 4,481 unique genes with a significant 24-h diurnal rhythm during a normal sleep-wake cycle in blood (false discovery rate [FDR] < 5%). Biological pathways were enriched for biosynthetic processes during sleep. After accounting for circadian effects, two genes (SREBF1 and CPT1A, both involved in lipid metabolism) exhibited small, but significant, linear changes in expression with the duration of sleep deprivation (FDR < 5%). The main change with sleep deprivation was a reduction in the amplitude of the diurnal rhythm of expression of normally cycling probe sets. This reduction was noticeably higher in behaviorally resistant subjects than sensitive subjects, at any given P value. Furthermore, blood cell type enrichment analysis showed that the expression pattern difference between sensitive and resistant subjects is mainly found in cells of myeloid origin, such as monocytes.

Conclusion: Individual differences in behavioral effects of sleep deprivation are associated with differences in diurnal amplitude of gene expression for genes that show circadian rhythmicity.

Keywords: circadian rhythm; gene expression; microarray analysis; psychomotor vigilance test; sleep deprivation.


Figures

Figure 1
Figure 1
Experimental design. Time points for blood draws (every 4 h across wake [yellow] and sleep periods [black]) and psychomotor vigilance test (PVT) data collection (every 2 h while awake). A total of 27 PVTs and 19 blood draws per subject were performed throughout the study period.
Figure 2
Figure 2
A robust circadian signature identified in human blood. (A) Agglomerative hierarchical clustering (blue dendrogram) of the mixed-model 8,064 probes with significant 24-h circadian changes (false discovery rate [FDR] < 5%, x-axis) ordered by collection time on y-axis, mixed subjects (y-axis, total blood samples n = 249). The total sleep deprivation period is shown by blue block (start: day 2, 08:00, end: day 3, 10:00). Values shown are the log-transformed ratios (Log R) of observed expression values to the corresponding average across the initial baseline 24-h period for each subject. (B) The phase distribution of peak expression of the 8,064 probe sets (or 4,481 genes) with significant 24-h circadian cycling during baseline sleep and wake: 48-bin histogram (30 min each across 24 h) shows the number of probe sets that reach their maximum expression in a particular half-hour period. The peak time of day is calculated from the sine and cosine regression coefficients in the statistical model.
Figure 3
Figure 3
The two genes with a significant linear trend in expression with sleep deprivation (false discovery rate < 5%); (A) SREBF1 and (B) CPT1A. Data are shown as mean ± standard deviation in normalized intensity on y-axis. The linear effects of sleep deprivation were very small for both genes: -0.03 and 0.06, respectively. No difference was found between sensitive and resistant subjects.
Figure 4
Figure 4
Decreased number of cycling probe sets in behaviorally resistant subjects during sleep deprivation. The graph shows the cumulative distribution of the number of cycling probe sets across 24 h (y-axis) below a specified P value (x-axis) during baseline and sleep deprivation. Data are shown for behaviorally sensitive subjects and resistant subjects separately. Although both groups are almost identical at baseline, the resistant subjects show markedly less cycling probe sets during sleep deprivation than sensitive subjects. The reference line represents the expected number of false-positives (FP) calculated based on the uniform P value distribution that is expected under the null hypothesis.
Figure 5
Figure 5
Distribution of amplitude changes in behaviourally resistant (A and C) and sensitive (B and D) subjects from baseline to sleep deprivation using 1,397 most robust circadian probe sets (false discovery rate < 5%). Probe sets are divided into lights on (A and B) and lights off (C and D) based on their peak expression time. No significant changes are found in behaviorally sensitive subjects but a highly significant decrease in amplitude is found in resistant subjects, especially during lights on. The amplitude change is shown as sleep deprivation minus baseline.
Figure 6
Figure 6
Interindividual circadian differences in response to sleep deprivation. A reduction in the pattern of diurnal cycling during sleep deprivation is not found in behaviourally sensitive subjects (A), only in resistant subjects (B). The heat maps represent agglomerative hierarchical clustering of the 788 probe sets that peak during light on in both (A) sensitive and (B) resistant subjects, respectively (false discovery rate [FDR] < 5%), ordered by time (y-axis) in (A) sensitive and (B) resistant subjects, respectively. The log-transformed ratios (Log R) of observed expression values relative to the corresponding average across the initial baseline 24-h period for each subject are shown. There is a much larger reduction in the amplitude of diurnal cycling (amplitude) of the 788 probe sets in resistant subjects (B) than in sensitive subjects (A) when comparing the baseline and sleep deprivation periods, which predominantly was represented by myeloid lineage cells (green labeled). Cytotoxic T cell gene expression is shown in red d.

Comment in

References

    1. Luckhaupt SE, Tak S, Calvert GM. The prevalence of short sleep duration by industry and occupation in the National Health Interview Survey. Sleep. 2010;33:149–59. - PMC - PubMed
    1. Leger D, Roscoat E, Bayon V, Guignard R, Paquereau J, Beck F. Short sleep in young adults: Insomnia or sleep debt? Prevalence and clinical description of short sleep in a representative sample of 1004 young adults from France. Sleep Med. 2011;12:454–62. - PubMed
    1. Goel N, Rao H, Durmer JS, Dinges DF. Neurocognitive consequences of sleep deprivation. Seminars in Neurology. 2009;29:320–39. - PMC - PubMed
    1. Kang JE, Lim MM, Bateman RJ, et al. Amyloid-beta dynamics are regulated by orexin and the sleep-wake cycle. Science. 2009;326:1005–7. - PMC - PubMed
    1. Van Dongen HP, Baynard MD, Maislin G, Dinges DF. Systematic interindividual differences in neurobehavioral impairment from sleep loss: evidence of trait-like differential vulnerability. Sleep. 2004;27:423–33. - PubMed

Publication types