. 2014 Oct 1;37(10):1621-37.
doi: 10.5665/sleep.4070.

Two distinct synchronization processes in the transition to sleep: a high-density electroencephalographic study

Affiliations

Two distinct synchronization processes in the transition to sleep: a high-density electroencephalographic study

Francesca Siclari et al. Sleep. .

Abstract

Objectives: To assess how the characteristics of slow waves and spindles change in the falling-asleep process.

Design: Participants undergoing overnight high-density electroencephalographic recordings were awakened at 15- to 30-min intervals. One hundred forty-one falling-asleep periods were analyzed at the scalp and source level.

Setting: Sleep laboratory.

Participants: Six healthy participants.

Interventions: Serial awakenings.

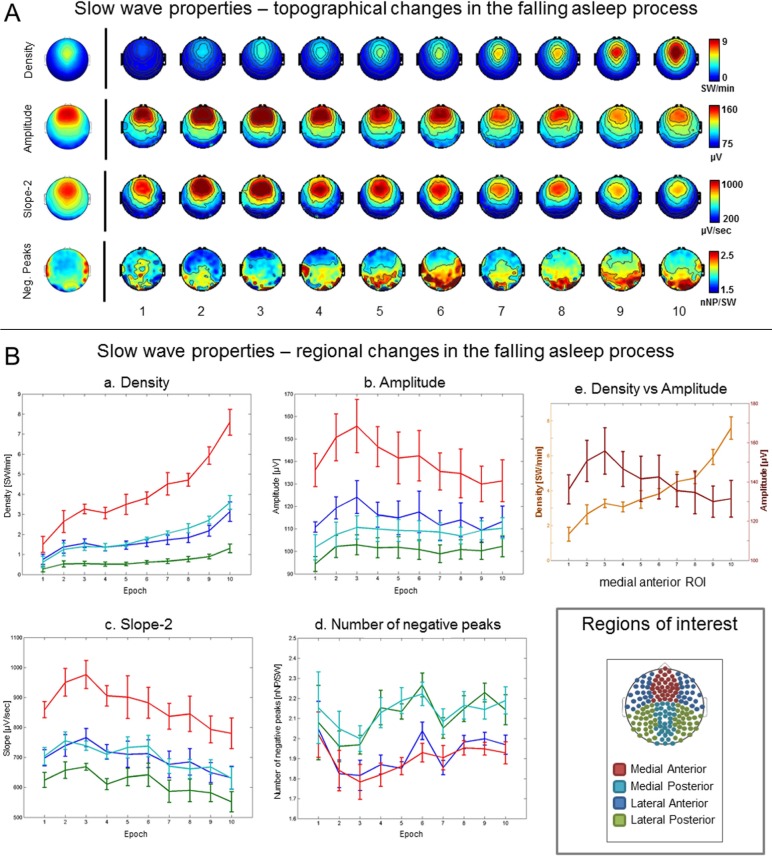
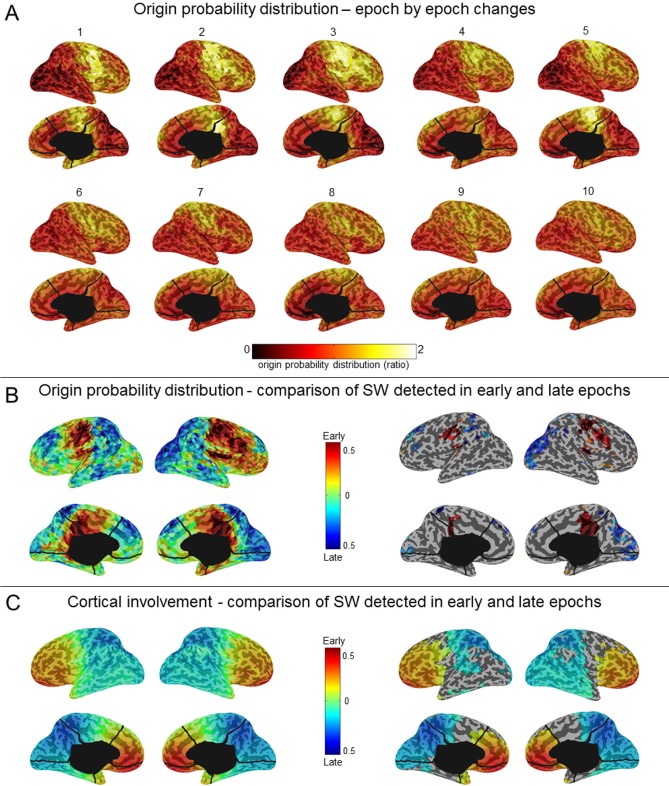
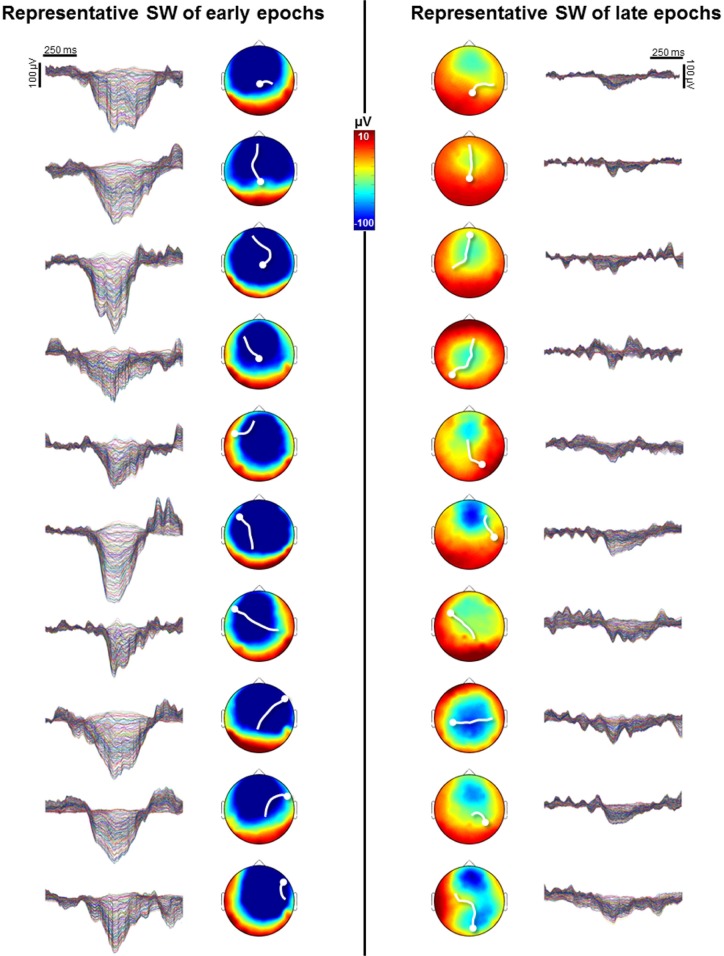
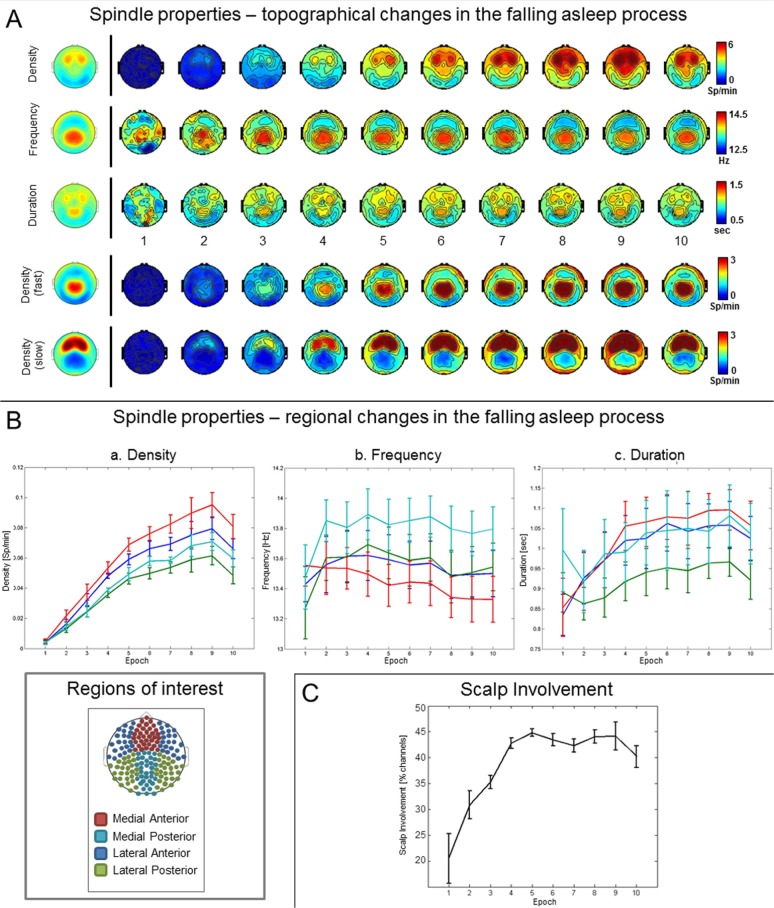
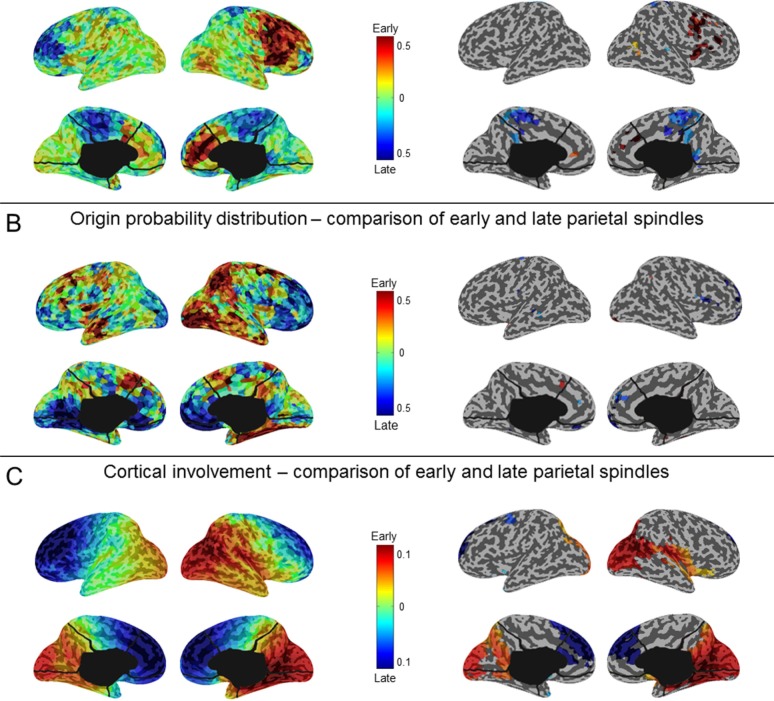
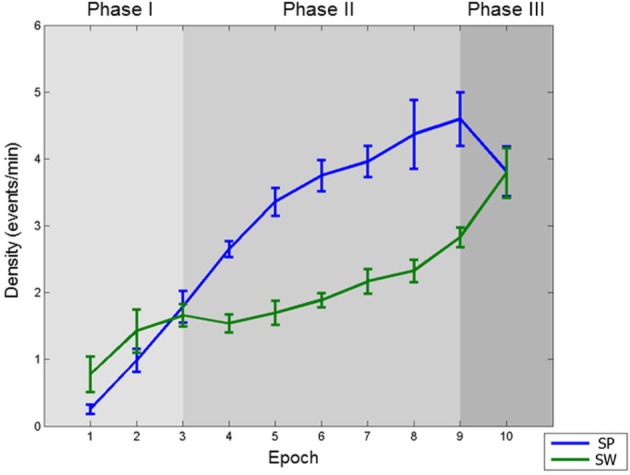
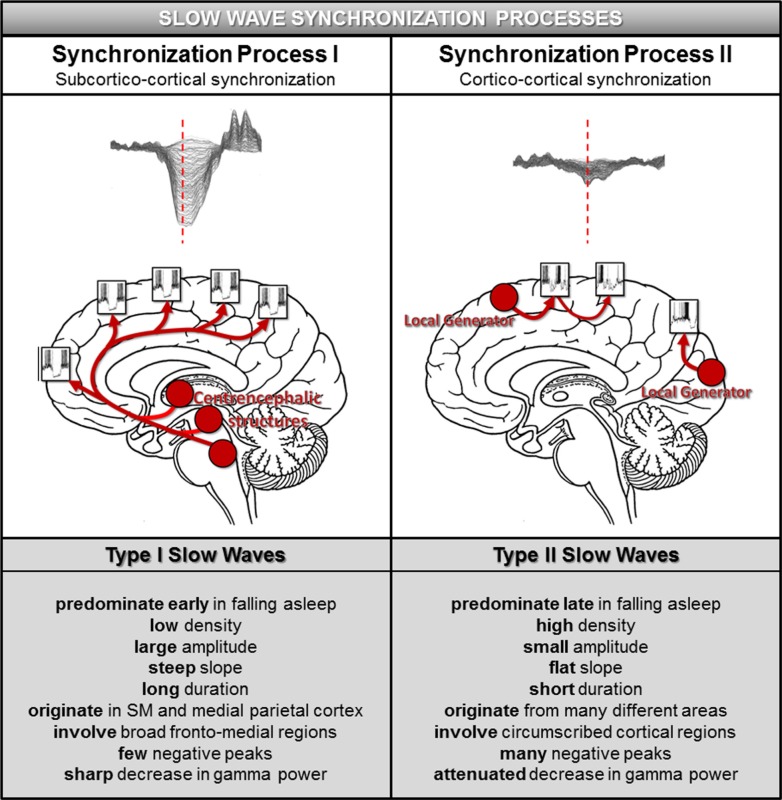
Results: The number and amplitude of slow waves followed two dissociated, intersecting courses during the transition to sleep: slow wave number increased slowly at the beginning and rapidly at the end of the falling-asleep period, whereas amplitude at first increased rapidly and then decreased linearly. Most slow waves occurring early in the transition to sleep had a large amplitude, a steep slope, involved broad regions of the cortex, predominated over frontomedial regions, and preferentially originated from the sensorimotor and the posteromedial parietal cortex. Most slow waves occurring later had a smaller amplitude and slope, involved more circumscribed parts of the cortex, and had more evenly distributed origins. Spindles were initially sparse, fast, and involved few cortical regions, then became more numerous and slower, and involved more areas.

Conclusions: Our results provide evidence for two types of slow waves, which follow dissociated temporal courses in the transition to sleep and have distinct cortical origins and distributions. We hypothesize that these two types of slow waves result from two distinct synchronization processes: (1) a "bottom-up," subcorticocortical, arousal system-dependent process that predominates in the early phase and leads to type I slow waves, and (2) a "horizontal," corticocortical synchronization process that predominates in the late phase and leads to type II slow waves. The dissociation between these two synchronization processes in time and space suggests that they may be differentially affected by experimental manipulations and sleep disorders.

Keywords: falling asleep; high-density EEG; neuronal synchronization; sleep; sleep-wake transition; slow waves; source modeling; spindles.


Figures

Figure 1
Figure 1
Slow waves: regional changes. (A) Topographical changes in slow wave density (slow waves per min [SW/min], first row), amplitude ([μV], second row), slope-2, corresponding to the slope of the negative to positive deflection of the slow wave ([μV/min], third row) and number of negative peaks per wave ([nNP/SW], fourth row) for the 10 consecutive epochs of the falling asleep period (group average). The images on the left of the black vertical line show the topographical distribution of the same characteristics obtained when considering the falling asleep period as a whole. (B) Evolution of slow wave density (a), amplitude (b), slope-2 (d) and number of negative peaks (e) for the four regions of interest (ROI) and 10 consecutive epochs of the falling asleep period (group average). Both amplitude and number are plotted on the same graph for the medial anterior ROI only (e). The small panel on the bottom right corner shows the ROIs used for analysis.
Figure 2
Figure 2
Slow waves: origin and involvement in source space. (A) Group averaged probabilistic distribution of slow wave origins shown on inflated cortical maps for each of the 10 consecutive epochs of the falling-asleep period. The probabilistic origin was defined as the probability for a specific voxel to represent the potential origin of a slow wave (top 10% voxels, which showed the earliest relative current maxima). To be able to compare results obtained in different epochs and subjects, we computed the ratio between the value in each voxel and the value resulting from the average of all brain voxels. (B) Inflated cortical maps of differences in probabilistic origins between slow waves detected in early and late epochs (left). Only areas that significantly differed between slow waves detected in early and late epochs are shown (signed rank test, P < 0.05; right). (C) Inflated cortical maps of differences in involvement between slow waves detected in early and late epochs (left). Involvement was defined as the average of the relative current achieved within a time-window of 100 ms centered on the negative voltage peak of the slow wave. Only areas that significantly differed between slow waves detected in early and late epochs are shown (signed rank test, P < 0.05; right).
Figure 3
Figure 3
Scalp involvement, origin, and propagation for representative slow waves (SW) of early and late epochs in one subject (S2). Slow waves detected in early epochs have a large amplitude and involve broader parts of the cortex when compared to slow waves detected in late epochs. In addition, slow waves detected in early epochs originate predominantly from a limited number of hotspots, whereas the origins of slow waves detected in late epochs are more evenly distributed over the cortex. The scalp involvement was defined as the average of current achieved during a 100 ms window around the negative peak of the electroencephalographic (EEG) slow wave (shown on the left and on the right for slow waves detected in early and late epochs respectively—185 channels). Scalp origins were determined using an algorithm similar to one that was previously described.,, Briefly, we determined for each EEG channel whether a negative peak was detected on the band-pass filtered signal within ± 200 ms of the reference wave peak. The timing of each involved channel's EEG peak was used to create a rectangular delay map grid with centimeter resolution based on electrode positions. A streamline tangential to the instantaneous velocity direction in the two-dimensional vector field of delays was determined for each involved electrode. The streamline for an individual electrode progressed in both directions along the vector field (up and down the gradient). The beginning of the longest streamline was considered the origin of the wave.
Figure 4
Figure 4
Spindles: regional changes and scalp synchronization. (A) Topographic changes in spindle density (spindles per min [Sp/min], first row), frequency ([Hz], second row) and duration ([sec], third row) for the 10 consecutive epochs of the falling asleep period (group average). The fifth and sixth rows show the topographic changes in fast and slow spindle density, respectively. The images on the left of the black vertical line show the topographical distribution of the same characteristics obtained when considering the falling asleep period as a whole. (B) Evolution of density (a) frequency (b) and duration (c) of spindles in the four regions of interest (ROI) for the 10 consecutive epochs of the falling asleep period (group average). The small panel on the bottom left corner shows the ROIs used for analysis. (C) Proportion of channels involved for each spindle detected in the reference channel across the 10 time epochs of the falling-asleep period. For each spindle we computed the number of synchronous detections in all other electrodes and expressed the scalp involvement as the mean percentage of channels showing a synchronous spindle during each epoch. Spindles were considered synchronous with the reference spindle either if the starting times were separated by less than 200 ms or if the half-spindles were separated by less than 400 ms.
Figure 5
Figure 5
Spindles: origin and involvement in source space. (A) Inflated cortical maps of differences in probabilistic origins between early and late phase frontal spindles (left). Only areas that significantly differed between early and late phase frontal spindles are shown (signed rank test, P < 0.05; right). The probabilistic origin was defined as the top 10% voxels, which showed the earliest relative current maxima after the beginning of the spindle. Only relative current maxima above a threshold of 50% of the absolute maximum identified across all dipoles were included in this analysis. (B) Inflated cortical maps of differences in probabilistic origins between early and late phase parietal spindles (left). Only areas that significantly differed between early and late phase parietal spindles are shown (signed rank test, P < 0.05; right). (C) Inflated cortical maps of differences in involvement between early and late phase parietal spindles (left). Only areas that significantly differed between early and late phase parietal spindles are shown (signed rank test, P < 0.05; right). For each voxel, spindle involvement was defined as the average relative current achieved in the whole duration of the spindle.
Figure 6
Figure 6
The three phases of the falling-asleep period. Spindle (SP) and slow wave (SW) densities (events per min) in the course of the 10 consecutive epochs of the falling-asleep period (group average). Three phases can be identified, as described in the main text: Phase I: slow wave and spindle densities increase sharply and almost in parallel; Phase II: both slow waves and spindles increase in number but follow different courses: slow wave density slightly decreases or remains stable, and then slowly increases, whereas spindle density continues to increase linearly; Phase III: slow waves and spindles show an opposite course: slow wave density rises steeply, whereas spindle density decreases.
Figure 7
Figure 7
Model of slow wave synchronization involving two processes. According to this model, slow waves in the transition to sleep are synchronized by two distinct processes. Synchronization Process I, underlying type I slow waves, operates in a bottom-up manner through subcortical projections to the cortex originating in arousal-related structures (left upper panel). The subcortical location and wide-spread nature of these projections result in a particularly fast and effective synchronization, giving rise to slow waves that display the characteristics outlined in the left lower panel. Synchronization Process II, associated with type II slow waves, represents a corticocortical (horizontal) synchronization. This type of synchronization is likely to be less efficient, as a cortical region can reach only a limited amount of neuronal populations at the same time, resulting in slow waves that have the features outlined in the right lower panel. SM = sensorimotor cortex.

Similar articles

Cited by

References

    1. Jones BE. From waking to sleeping: neuronal and chemical substrates. Trends Pharmacol Sci. 2005;26:578–86. - PubMed
    1. Steriade M. Corticothalamic resonance, states of vigilance and mentation. Neuroscience. 2000;101:243–76. - PubMed
    1. Nir Y, Staba RJ, Andrillon T, et al. Regional slow waves and spindles in human sleep. Neuron. 2011;70:153–69. - PMC - PubMed
    1. Andrillon T, Nir Y, Staba RJ, et al. Sleep spindles in humans: insights from intracranial EEG and unit recordings. J Neurosci. 2011;31:17821–34. - PMC - PubMed
    1. Esser SK, Huber R, Massimini M, Peterson MJ, Ferrarelli F, Tononi G. A direct demonstration of cortical LTP in humans: a combined TMS/EEG study. Brain Res Bull. 2006;69:86–94. - PubMed

Publication types