

Tongue fat and its relationship to obstructive sleep apnea
- PMID: 25197815
- PMCID: PMC4173920
- DOI: 10.5665/sleep.4072
Tongue fat and its relationship to obstructive sleep apnea
Abstract
Study objectives: The objective of this study was to determine whether tongue fat is increased in obese sleep apneics compared to obese subjects without sleep apnea. We hypothesized that excess fat is deposited in the tongue in obese patients with sleep apnea.
Design: Case-control design.
Setting: Academic medical center.
Patients: We examined tongue fat in 31 obese controls (apnea-hypopnea index, 4.1 ± 2.7 events/h) and 90 obese apneics (apnea-hypopnea index, 43.2 ± 27.3 events/h). Analyses were repeated in a subsample of 18 gender-, race-, age-, and BMI-matched case-control pairs.
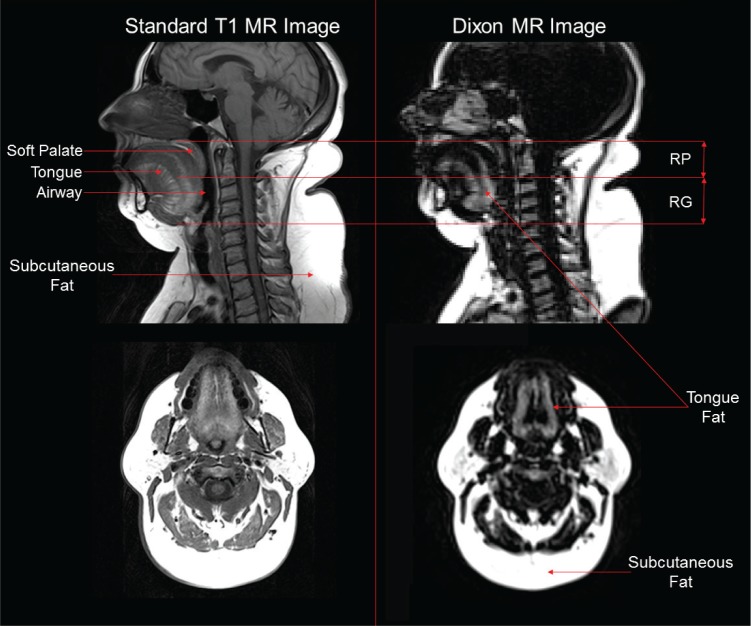
Interventions: All subjects underwent a MRI with three-point Dixon magnetic resonance imaging. We used sophisticated volumetric reconstruction algorithms to study the size and distribution of upper airway fat deposits in the tongue and masseter muscles within apneics and obese controls.
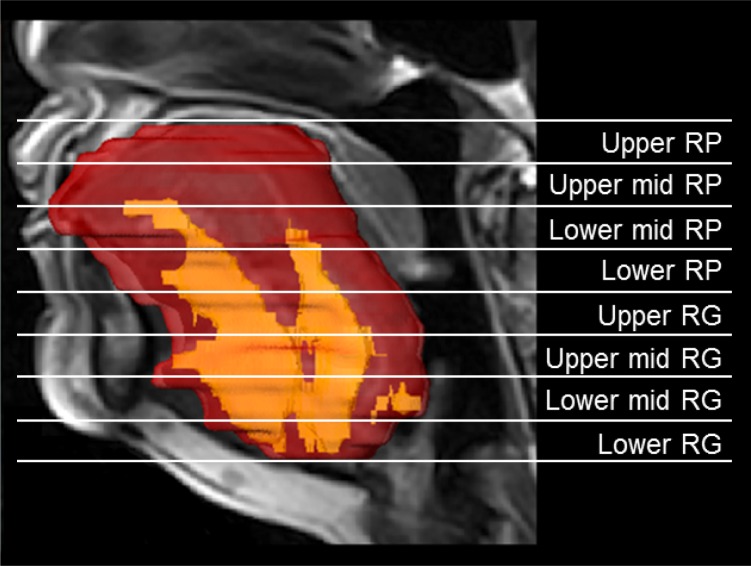
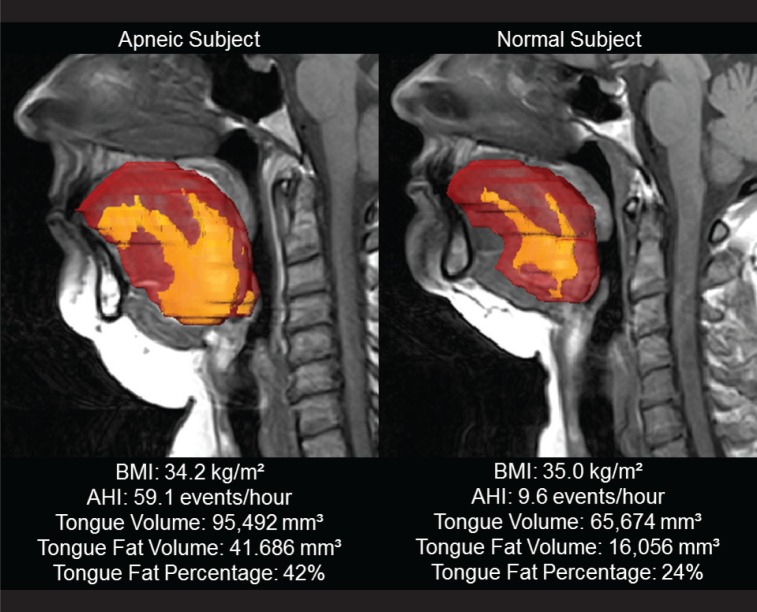
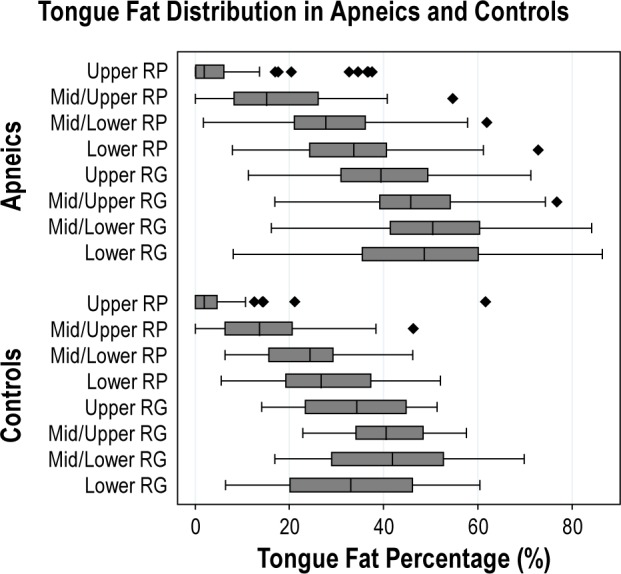
Measurements and results: The data supported our a priori hypotheses that after adjustment for age, BMI, gender, and race, the tongue in apneics was significantly larger (P = 0.001) and had an increased amount of fat (P = 0.002) compared to controls. Similar results were seen in our matched sample. Our data also demonstrate that within the apneic and normal tongue, there are regional differences in fat distribution, with larger fat deposits at the base of the tongue.
Conclusions: There is increased tongue volume and deposition of fat at the base of tongue in apneics compared to controls. Increased tongue fat may begin to explain the relationship between obesity and obstructive sleep apnea.
Keywords: obstructive sleep apnea; tongue fat.
© 2014 Associated Professional Sleep Societies, LLC.
Figures

Comment in
-
Does my tongue look fat?Sleep. 2014 Oct 1;37(10):1583-4. doi: 10.5665/sleep.4058. Sleep. 2014. PMID: 25197800 Free PMC article. No abstract available.
References
-
- Somers VK, White DP, Amin R, et al. Sleep apnea and cardiovascular disease: an American Heart Association/American College of Cardiology Foundation scientific statement from the American Heart Association Council for High Blood Pressure Research Professional Education Committee, Council on Clinical Cardiology, Stroke Council, and Council on Cardiovascular Nursing. Circulation. 2008;118:1080–111. - PubMed
-
- Tufik S, Santos-Silva R, Taddei JA, Bittencourt LR. Obstructive sleep apnea syndrome in the Sao Paulo Epidemiologic Sleep Study. Sleep Med. 2010;11:441–6. - PubMed
-
- Marin JM, Carrizo SJ, Vicente E, Agusti AG. Long-term cardiovascular outcomes in men with obstructive sleep apnoea-hypopnoea with or without treatment with continuous positive airway pressure: an observational study. Lancet. 2005;365:1046–53. - PubMed
SUPPLEMENTAL REFERENCES
-
- Schwab RJ, Pasirstein M, Pierson R, et al. Identification of upper airway anatomic risk factors for obstructive sleep apnea with volumetric magnetic resonance imaging. Am J Respir Crit Care Med. 2003;168:522–30. - PubMed
-
- Iber C, Ancoli-Israel S, Chesson A, Quan SF. Westchester, IL: American Academy of Sleep Medicine; 2007. The AASM manual for the scoring of sleep and associated events: rules, terminology and technical specifications.
-
- Arens R, McDonough JM, Corbin AM, et al. Linear dimensions of the upper airway structure during development: assessment by magnetic resonance imaging. Am J Respir Crit Care Med. 2002;165:117–22. - PubMed
-
- Hubalkova H, La Serna P, Linetskiy I, Dostalova T. Dental alloys and magnetic resonance imaging. Int Dent J. 2006;56:135–41. - PubMed
Publication types
MeSH terms
Grants and funding
LinkOut - more resources
Full Text Sources
Other Literature Sources
Medical
