. 2014 Sep 8;9(9):e106784.
doi: 10.1371/journal.pone.0106784. eCollection 2014.

Pharmacogenomic approach to identify drug sensitivity in small-cell lung cancer

Affiliations

Pharmacogenomic approach to identify drug sensitivity in small-cell lung cancer

Gary Wildey et al. PLoS One. .

Abstract

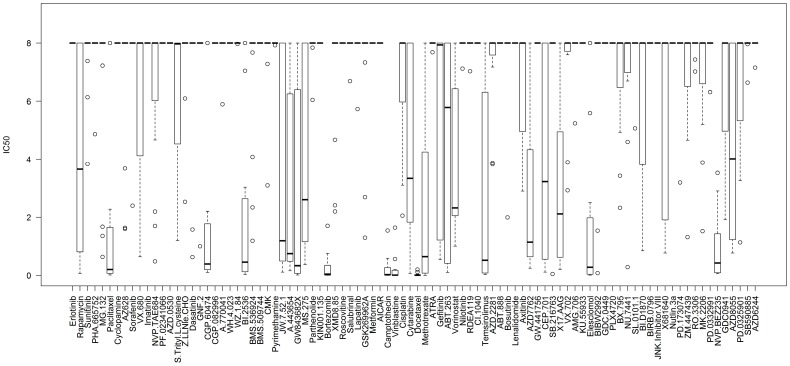
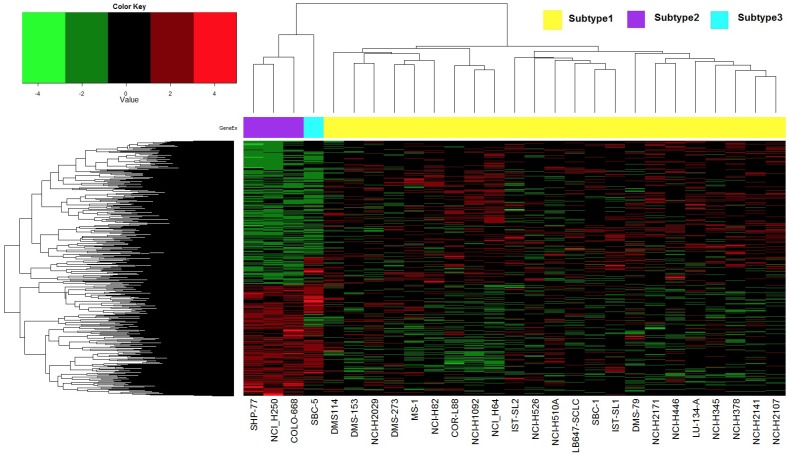
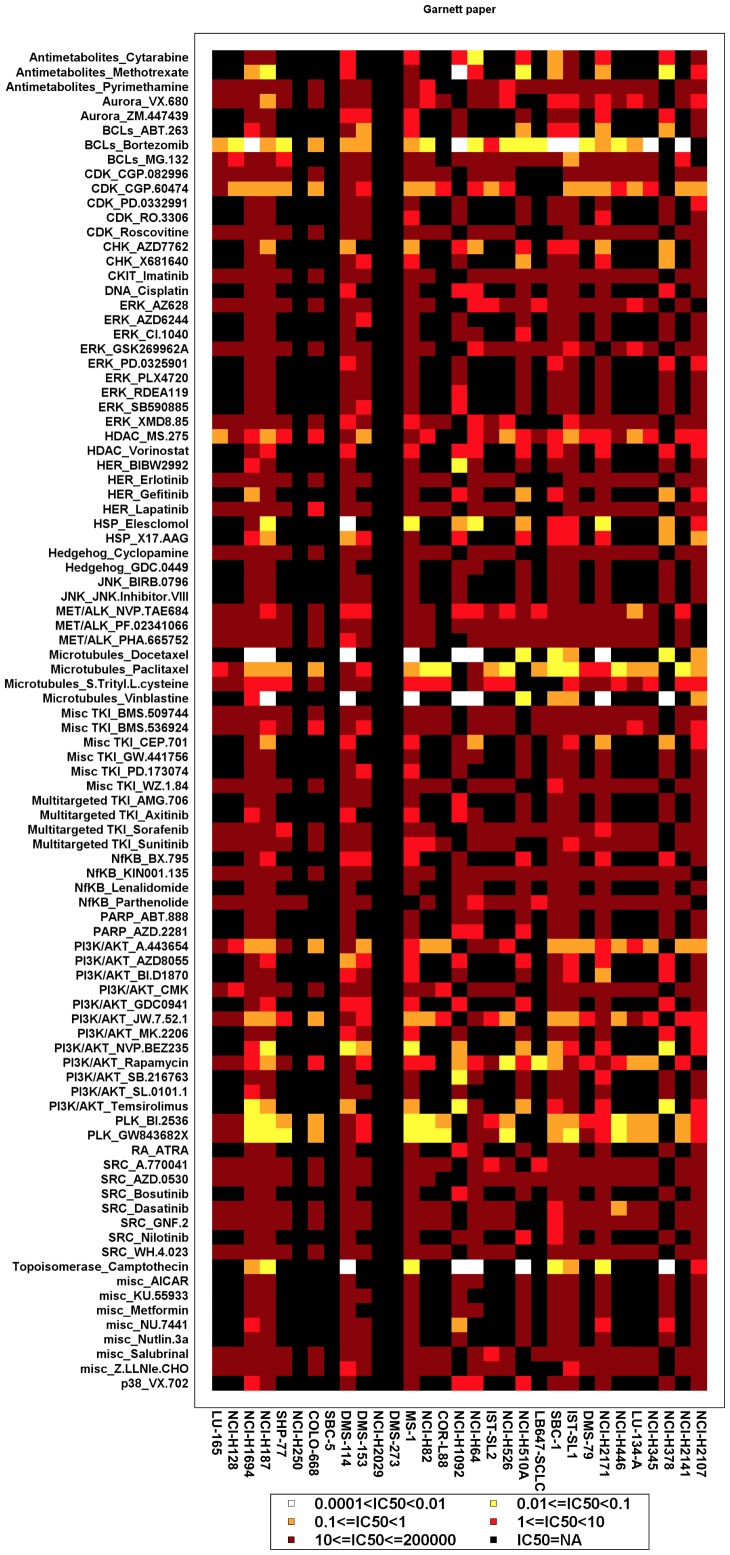
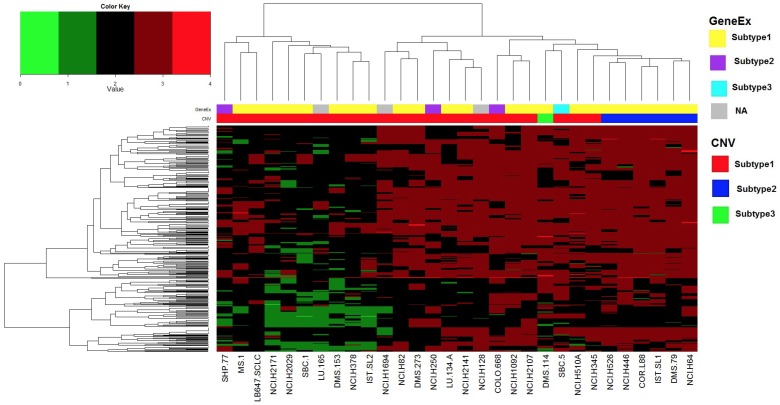
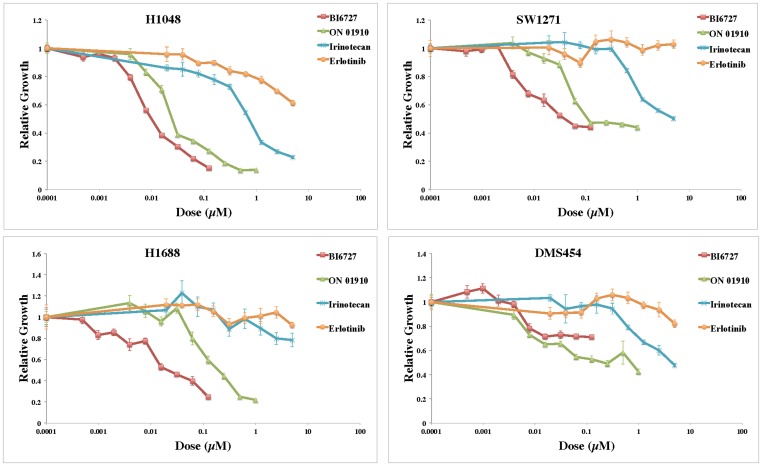
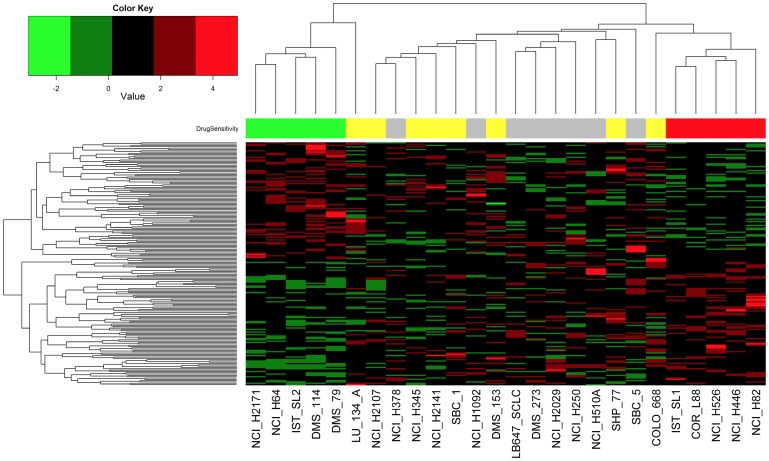
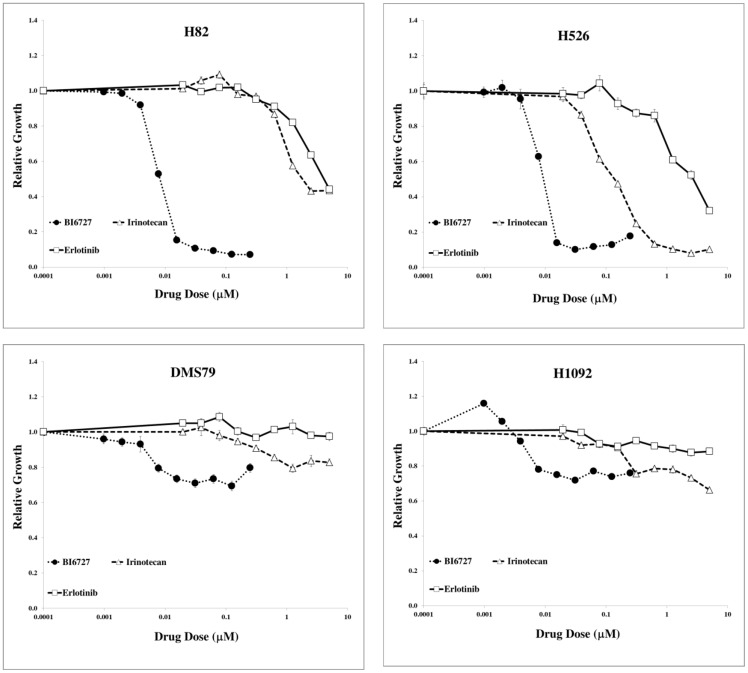
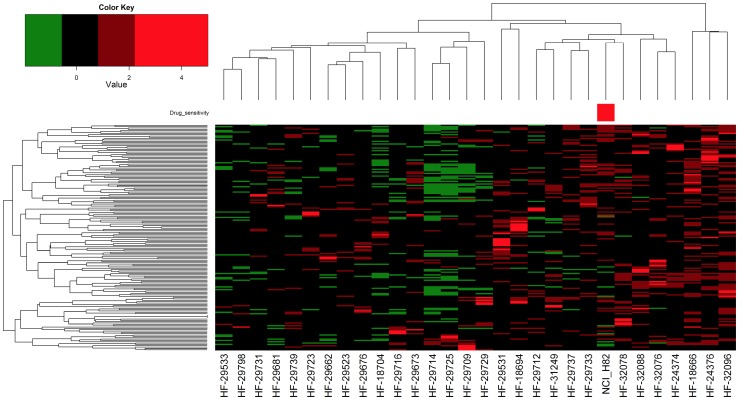
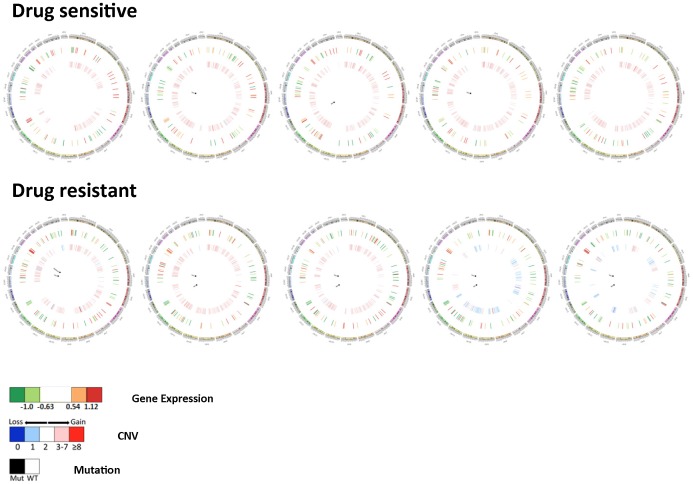
There are currently no molecular targeted approaches to treat small-cell lung cancer (SCLC) similar to those used successfully against non-small-cell lung cancer. This failure is attributable to our inability to identify clinically-relevant subtypes of this disease. Thus, a more systematic approach to drug discovery for SCLC is needed. In this regard, two comprehensive studies recently published in Nature, the Cancer Cell Line Encyclopedia and the Cancer Genome Project, provide a wealth of data regarding the drug sensitivity and genomic profiles of many different types of cancer cells. In the present study we have mined these two studies for new therapeutic agents for SCLC and identified heat shock proteins, cyclin-dependent kinases and polo-like kinases (PLK) as attractive molecular targets with little current clinical trial activity in SCLC. Remarkably, our analyses demonstrated that most SCLC cell lines clustered into a single, predominant subgroup by either gene expression or CNV analyses, leading us to take a pharmacogenomic approach to identify subgroups of drug-sensitive SCLC cells. Using PLK inhibitors as an example, we identified and validated a gene signature for drug sensitivity in SCLC cell lines. This gene signature could distinguish subpopulations among human SCLC tumors, suggesting its potential clinical utility. Finally, circos plots were constructed to yield a comprehensive view of how transcriptional, copy number and mutational elements affect PLK sensitivity in SCLC cell lines. Taken together, this study outlines an approach to predict drug sensitivity in SCLC to novel targeted therapeutics.


Conflict of interest statement

Competing Interests: The authors have declared that no competing interests exist.

Figures

Figure 1
Figure 1. Boxplot of drug sensitivity in SCLC cells using the CGP dataset.
There are 31 cell lines for small cell lung cancer. The boxplots show drugs listed on the x-axis and the corresponding IC50 values (in µM) listed on the y-axis. The ‘ceiling’ for drug efficacy was set at 8 µM; if the IC50 of all tested cells was above this concentration a single line would appear at the top of the graph. This represents an ineffective drug. By contrast, if all tested cells were sensitive to a given drug, a narrow box and whisker plot would appear at the bottom of the graph. The line within individual boxes represents the median IC50 value of all tested cells and the circles represent ‘outlier’ cells whose IC50 values do not fall within the 25–75% quantile of all IC50 values measured for that drug (represented by the box).
Figure 2
Figure 2. Unsupervised clustering of SCLC cells by gene expression using the CGP dataset.
Unsupervised consensus clustering was performed using all 31 cell lines (only 27 had gene expression data available; 3 of them are duplicates and the average values were obtained for further analysis) and showed that 3 clusters was optimal for this dataset. With this assignment, non-parametric one way ANOVA (Kruskal-Wallis test p-value<0.05) was performed on these 3 clusters and 1006 significant genes were obtained. The heatmap was generated with these significant genes.
Figure 3
Figure 3. Mosaic plot of drug sensitivity using gene expression clustering of SCLC cells.
Drug sensitivity was color-coded according to the legend at the bottom. Drugs are grouped along the y-axis according to their target molecule. Cells are arranged along the x-axis identical to their gene expression clustering identified in Figure 2.
Figure 4
Figure 4. Unsupervised clustering of SCLC cells by copy number variation using the CGP dataset.
Unsupervised consensus clustering was performed using all 30 cell lines with 426 gene copy numbers, and 3 clusters were shown to be optimal for this dataset. All of these 426 genes were used to generate the heatmap. CNV data was re-coded according to the following rule: 0-complete loss; 1-partial loss; 2-no change; 3∼7-partial gain; greater or equal to 8-complete gain.
Figure 5
Figure 5. Validation of efficacy of PLK inhibitors in SCLC cells.
Adherent cells were incubated with the indicated concentrations of drugs for 24 h. The cell culture medium was replaced and cell viability was measured by a DNA assay after 48 h incubation. Each drug concentration was assayed utilizing five replicates. Results are representative of at least 2 experiments.
Figure 6
Figure 6. Unsupervised clustering of SCLC cells using the PLK gene signature.
The five SCLC cell lines demonstrating the most (H2171, H64, IST-SL2, DMS-114, DMS-79) and least (IST-SL1, COR-L88, H526, H446, H82) resistance to the PLK inhibitor BI-2536 in the CGP study were used as standards to identify a gene signature for PLK sensitivity. All SCLC cell lines in the CGP study that contained gene expression data were then subjected to unsupervised clustering. The heatmap shows the result of this analysis. The colored boxes on the top of the heatmap indicate the CGP BI-2536 sensitivity. Green  =  resistant cell, red  =  sensitive cell, yellow  =  cell of intermediate, but known, sensitivity, grey  =  cell of untested sensitivity but with gene expression data.
Figure 7
Figure 7. Validation of PLK efficacy in SCLC cells predicted by PLK gene signature.
Suspension cells were continuously incubated with the indicated concentrations of drugs for 72 h, when cell viability was measured by the MTS assay. Each drug concentration was assayed utilizing five replicates. Results are representative of 2 experiments.
Figure 8
Figure 8. Supervised clustering of SCLC tumors and H82 cell line using the PLK gene signature.
RNAseq data from Rudin et al. was transformed to count data. Data for genes that comprised the PLK gene expression signature were extracted and used in unsupervised consensus clustering of SCLC tumors and the H82 cell line. The red colored box on the top of the heatmap indicates the location of the H82 cell line, which was a CGP cell line validated as PLK sensitive.
Figure 9
Figure 9. Circos plots of SCLC cells.
Circos plots are shown (left to right, in listed order) for the five most sensitive (H82, H446, H526, COR-L88, IST-SL1) and most resistant (DMS-114, H64, DMS-79, H2171, IST-SL2) SCLC cells to BI-2536 growth inhibition, as defined in the CGP study. The outer black ring designates the chromosome location; the next inner ring indicates expression level of PLK signature genes; and the inner most ring indicates CNV. CNV data was re-coded according to the following rule: 0 complete loss; 1 partial loss; 2 no change; 3∼7 partial gain; greater or equal to 8 complete gain. At the center is the mutation status of genes (open triangle: intronic SNP, black circle: missense SNP, black square: nonsense SNP, red triangle: frame-shift insertion, green triangle: frame-shift deletion). All mutations were homozygous except for the frame-shift insertion.

References

    1. Jackman DM, Johnson BE (2005) Small-cell lung cancer. The Lancet 366: 1385–1396. - PubMed
    1. D'Angelo SP, Pietanza MC (2010) The molecular pathogenesis of small cell lung cancer. Cancer Biology & Therapy 10: 1–10. - PubMed
    1. Hurwitz JL, McCoy F, Scullin P, Fennell DA (2009) New advances in the second-line treatment of small cell lung cancer. The Oncologist 14: 986–994. - PubMed
    1. William WN, Glisson BS (2011) Novel strategies for the treatment of small-cell lung carcinoma. Nat Rev Clin Oncol 8: 611–619. - PubMed
    1. Nickolich M, Babakoohi S, Fu P, Dowlati A (2014) Clinical Trial Design in Small Cell Lung Cancer: Surrogate End Points and Statistical Evolution. Clin Lung Cancer 15: 207–212. - PubMed

Publication types

MeSH terms

Substances