. 2014 Sep 8;9(9):e107416.
doi: 10.1371/journal.pone.0107416. eCollection 2014.

Cellular, molecular and functional characterisation of YAC transgenic mouse models of Friedreich ataxia

Affiliations

Cellular, molecular and functional characterisation of YAC transgenic mouse models of Friedreich ataxia

Sara Anjomani Virmouni et al. PLoS One. .

Abstract

Background: Friedreich ataxia (FRDA) is an autosomal recessive neurodegenerative disorder, caused by a GAA repeat expansion mutation within intron 1 of the FXN gene. We have previously established and performed preliminary characterisation of several human FXN yeast artificial chromosome (YAC) transgenic FRDA mouse models containing GAA repeat expansions, Y47R (9 GAA repeats), YG8R (90 and 190 GAA repeats) and YG22R (190 GAA repeats).

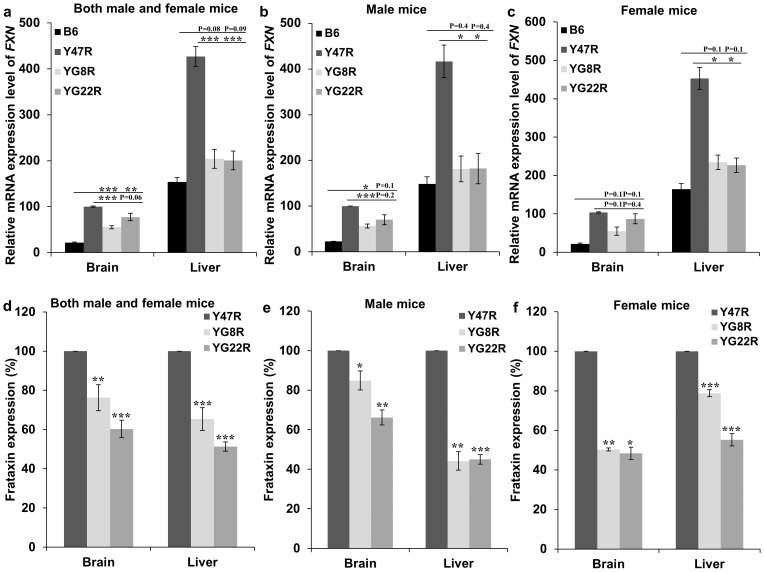
Methodology/principal findings: We now report extended cellular, molecular and functional characterisation of these FXN YAC transgenic mouse models. FXN transgene copy number analysis of the FRDA mice demonstrated that the YG22R and Y47R lines each have a single copy of the FXN transgene while the YG8R line has two copies. Single integration sites of all transgenes were confirmed by fluorescence in situ hybridisation (FISH) analysis of metaphase and interphase chromosomes. We identified significant functional deficits, together with a degree of glucose intolerance and insulin hypersensitivity, in YG8R and YG22R FRDA mice compared to Y47R and wild-type control mice. We also confirmed increased somatic GAA repeat instability in the cerebellum and brain of YG22R and YG8R mice, together with significantly reduced levels of FXN mRNA and protein in the brain and liver of YG8R and YG22R compared to Y47R.

Conclusions/significance: Together these studies provide a detailed characterisation of our GAA repeat expansion-based YAC transgenic FRDA mouse models that will help investigations of FRDA disease mechanisms and therapy.


Conflict of interest statement

Competing Interests: The authors have declared that no competing interests exist.

Figures

Figure 1
Figure 1. Transgene copy number.
(a) Two TaqMan copy number assays were applied; Hs05092416-cn assay, represented in black, was designed to amplify a 106 bp fragment of FXN within intron 3 and Hs02407730-cn assay, represented in grey, was designed to amplify an 80 bp fragment of FXN within intron 1 and exon 2. Wild type (WT) served as a negative control with no copy number. Error bars = SD. n = 2. (b and c) Determination of the integration site of the transgenic FXN gene by FISH. Biotin-labelled RP11-265B8 and digoxigenin- labelled RP11-876N18 probes were hybridised onto interphase and metaphase chromosomes (DAPI stained) of YG8R, YG22R and Y47R cells. (b) All three cell lines showed a single integration site of the FXN transgene by metaphase analysis. (c) YG8R showed three hybridisation signals corresponded to the transgenic FXN, whereas YG22R and Y47R showed one signal indicating one copy of the FXN transgene. Scale bare = 10 µm.
Figure 2
Figure 2. Rotarod and weight analysis.
YG22R and YG8R FRDA mice show a coordination deficit compared to B6 and Y47R controls when (a) both male and female values were taken together (n = 10 mice per genotype) or (b) male alone (n = 5 mice per genotype) or (c) female alone (n = 5 mice per genotype). (d) Weight analysis of YG22R and YG8R compared to B6 and Y47R controls when both male and female values were taken together (n = 10 mice per genotype). The results indicated a significant increase in weight of all FRDA mice in comparison to B6 control. A similar tendency was seen when (e) male and (f) female values were analysed separately (n = 5 mice per genotype). Values represent mean ± SEM.
Figure 3
Figure 3. Average velocity of FRDA mice.
(a) YG8R and YG22R displayed significantly decreased average velocity compared to B6 and Y47R controls when both male and female values were taken together (n = 10 mice per genotype). Analysis of (b) males and (c) females separately (n = 5 mice per genotype) revealed that both deficient genotypes had decreased average velocity compared to the controls. Values represent mean ± SEM.
Figure 4
Figure 4. Beam-walk and hang-wire analysis.
(a–c) Beam-walk. (a) Analysis of YG8R and YG22R compared to B6 and Y47R controls showed a coordination deficit on both 22 mm and 12 mm beams in all rescue mice (n = 10 mice per genotype) when both male and female values were taken together. However, no significant difference in beam-walk of YG22R on the 12 mm beam was observed in comparison to Y47R control. (b) Beam-walk analysis of YG8R and YG22R male mice compared to B6 control (n = 5 mice per genotype) revealed that both deficient genotypes required significantly more time to cross the 22 mm and 12 mm beams, however there was no significant difference between these mice and Y47R control. (c) Analysis of YG8R female (n = 5 mice per genotype) showed that these mice took significantly longer than B6 and Y47R to cross both 22 mm and 12 mm beams. Although YG22R followed a similar performance trend as that of YG8R on the 22 mm and 12 mm beams compared to B6 and Y47R controls, the difference in beam-walk on 12 mm beam was not significant. (d–f) Hang wire. (d) Analysis of YG8R and YG22R revealed impaired neuromuscular strength and lack of coordinated motor control compared to B6 and Y47R controls when both male and female values were taken together (n = 10 mice per genotype). Analysis of YG8R and YG22R (e) males and (f) females separately (n = 5 mice per genotype) revealed the same pattern compared to B6 and Y47R controls. However, there was no significant different between all male mutant and Y47R control mice. Values represent mean ± SEM. *P<0.05, **P<0.01 and ***P<0.001. Statistical differences between mutant and B6 control mice are indicated by the top bar while the bottom bar indicates the differences between mutant and Y47R control mice.
Figure 5
Figure 5. Grip strength analysis.
(a) Analysis of YG8R and YG22R mice revealed significantly reduced grip strength compared to B6 and Y47R controls when both males and females were analysed together (n = 10 mice per genotype). Analysis of (b) males and (c) females separately (n = 5 mice per genotype) revealed a significant decrease in grip strength of all mutant mice compared to the controls Values represent mean ± SEM. **P<0.01 and ***P<0.001. Statistical differences between mutant and B6 control mice are indicated by the top bar while the bottom barindicates the differences between mutant and Y47R control mice.
Figure 6
Figure 6. Footprint analysis.
(a–c) Stride length (average of both left and right hindlimb, and left and right forelimb) analysis of mice. (a) Analysis of YG8R andYG22R mice revealed significantly reduced stride length compared to B6 and Y47R controls when both male and female values were taken together (n = 10 mice per genotype). Analysis of (b) males and (c) females separately (n = 5 mice per genotype). (d–f) Base width (average of forelimb and hindlimb base width) analysis of mice. (d) Analysis of YG8R and YG22R mice revealed significantly shorter base width compared to B6 and Y47R controls when both male and female values were taken together (n = 10 mice per genotype). Analysis of (e) males and (f) females separately (n = 5 mice per genotype) revealed a significant decrease in base width of both mutant mice compared to controls. Values represent mean ± SEM. *P<0.05, **P<0.01 and ***P<0.001. Statistical differences between mutant and B6 control mice are indicated by the top bar while the bottom bar indicates the differences between mutant and Y47R control mice.
Figure 7
Figure 7. Glucose and insulin tolerance tests.
(a–c) Glucose tolerance test. (a) Glucose concentration was higher in YG8R and YG22R compared to B6 and Y47R controls when both male and female values were taken together (n = 10 mice per genotype). (b) Similar results were obtained when male values were considered alone (n = 5 mice per genotype). (c) Analysis of female mice showed no difference between the FRDA and control mice (n = 5 mice per genotype). (d–f) Insulin tolerance test. (d) YG8R and YG22R showed lower blood glucose level after insulin injection compared to B6 and Y47R controls when both male and female values were considered. (e) Although the blood glucose concentration was normalised after 50 minutes, FRDA male mice exhibited a more rapid glucose lowering after insulin injection. (f) Female mice showed a greater reduction in blood glucose concentration after 50 minutes. Values represent mean ± SEM. *P<0.05, **P<0.01 and ***P<0.001.
Figure 8
Figure 8. Somatic GAA repeat instability.
A representative 1.5% agarose gel shows GAA repeat PCR products from different somatic tissues (Tail (Ta), Brain (B), Cerebellum (C), Liver (L), Heart (H), Kidney (K), Pancreas (P)) of YG8R (Lanes 2 to 9); YG22R (Lanes 10 to 16) and Y47R (Lanes 17 to 23) lines. 1 kb+ and 100 bp DNA ladders were used as the molecular marker.
Figure 9
Figure 9. Frataxin expression levels.
(a–c) qRT–PCR analysis of transgenic FXN mRNA using mouse-human specific primers. (a) Analysis of males and females together. Analysis of (b) males and (c) females separately. Data were normalised to the mean FXN mRNA level of Y47R brain samples taken as 100%. Statistical differences between the mutant and B6 controls are indicated by the top bar while the bottom bar indicates the differences between the mutant and Y47R controls. (d–f) Dipstick immunoassay of human frataxin protein. (d) Analysis of males and females together, (e) males and (f) females separately. Data were normalised to the mean FXN level of Y47R samples taken as 100%. Values represent mean ± SEM. *P<0.05, **P<0.01 and ***P<0.001. n = 4–8.

References

    1. Campuzano V, Montermini L, Molto MD, Pianese L, Cossee M, et al. (1996) Friedreich's ataxia: Autosomal recessive disease caused by an intronic GAA triplet repeat expansion. Science 271: 1423–1427 10.1126/science.271.5254.1423 - DOI - PubMed
    1. Pandolfo M (2002) The molecular basis of Friedreich ataxia. Adv Exp Med Biol 516: 99–118. - PubMed
    1. Gerber J, Muhlenhoff U, Lill R (2003) An interaction between frataxin and Isu1/Nfs1 that is crucial for Fe/S cluster synthesis on Isu1. EMBO Rep 4: 906–911. - PMC - PubMed
    1. Campuzano V, Montermini L, Lutz Y, Cova L, Hindelang C, et al. (1997) Frataxin is reduced in Friedreich ataxia patients and is associated with mitochondrial membranes. Hum Mol Genet 6: 1771–1780 10.1093/hmg/6.11.1771 - DOI - PubMed
    1. Koeppen AH (2011) Friedreich's ataxia: Pathology, pathogenesis, and molecular genetics. J Neurol Sci 303: 1–12 10.1016/j.jns.2011.01.010 - DOI - PMC - PubMed

Publication types

MeSH terms