

doi: 10.1371/journal.pone.0101480.
eCollection 2014.
Intrinsic differences between oral and skin keratinocytes
Affiliations
- PMID: 25198578
- PMCID: PMC4157746
- DOI: 10.1371/journal.pone.0101480
Item in Clipboard
Intrinsic differences between oral and skin keratinocytes
PLoS One.
.
Abstract
Keratinocytes cover both the skin and some oral mucosa, but the morphology of each tissue and the behavior of the keratinocytes from these two sites are different. One significant dissimilarity between the two sites is the response to injury. Oral mucosal wounds heal faster and with less inflammation than equivalent cutaneous wounds. We hypothesized that oral and skin keratinocytes might have intrinsic differences at baseline as well as in the response to injury, and that such differences would be reflected in gene expression profiles.
Conflict of interest statement
Figures
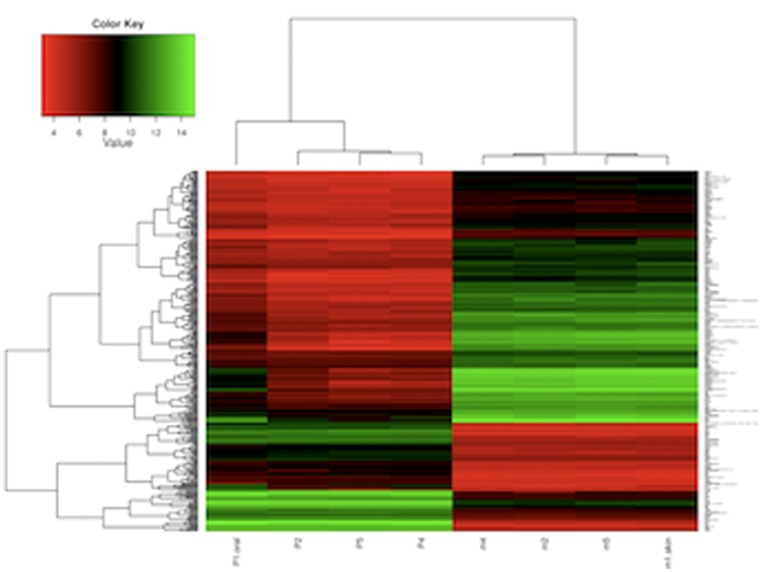
The heatmap indicates gene expression in the skin and oral epithelium is significantly different. The color key shows the assignment of color to the expression intensity value. FDR<0.01, N = 4. The clustering is based on hierarchical clustering with squared Euclidean distance between the samples and complete linkage. The heatmaps were generated using package "gplots” in R (http://www.r-project.org ).
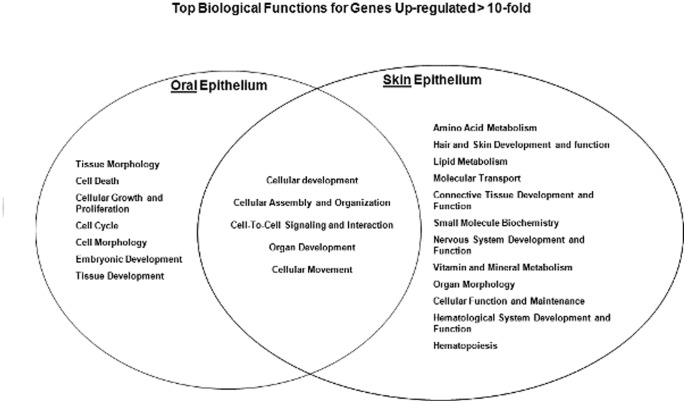
Fischer's exact test was used to calculate a p-value (<0.01) determining the probability each biological function assigned to data set is due to chance alone. Ingenuity Pathway Analysis software.
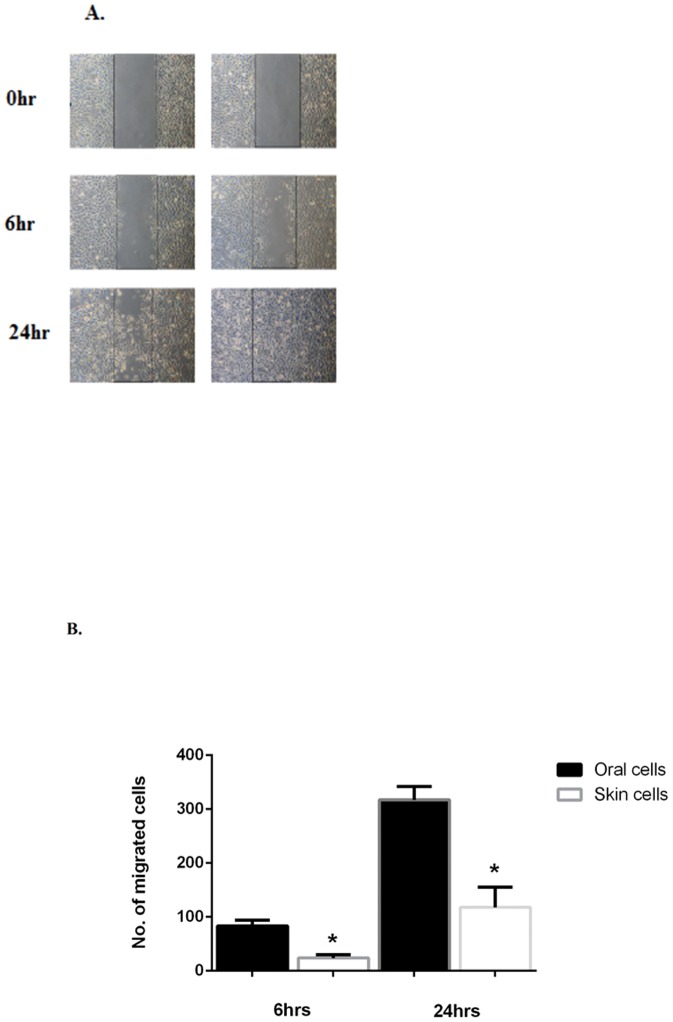
Human primary oral and skin keratinocyte monolayers were wounded by scratches. A) The defined areas were photographed at 0, 6 and 24 hours after wounding. B) The number of cells in the denuded initial area were counted. Number of cells 6 hours post scratch: oral 83.4±10.9 vs skin 23.8±6.4. Number of cells 24 hours post scratch: oral 317.3±24.8 vs skin 118.0±37.6 *P<0.01. Student's t-test was used to compare the difference between oral and skin wounds at each time point and two-way ANOVA was used to evaluate grouped data over time. N = 3.
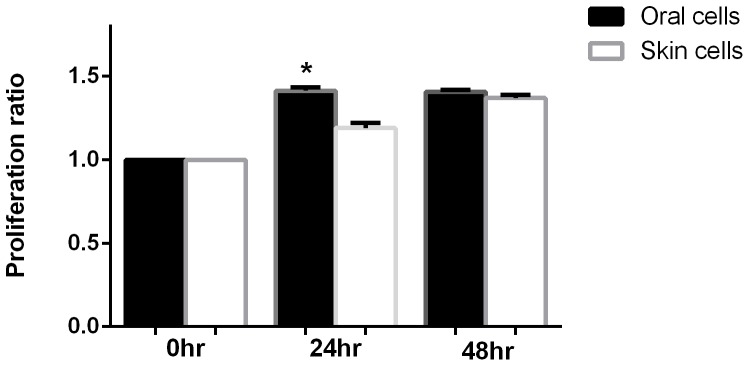
Isolated primary paired human keratinocytes (skin and hard palate) were cultured for In Vitro scratch assays. Keratinocyte proliferation was measured at time points of 0, 24, and 48 hours post scratch with CellTiter96 Aqueous One Solution Cell Proliferation Assay. Proliferation ratio was determined by the formula: ODX hrs post-scratch/OD0 hrs post-scratch. OD was read at an absorbance of 490 nm. 24 hours post scratch skin 1.190±0.03 vs oral 1.413± 0.02; 48 hours post scratch skin 1.370±0.02 vs oral 1.408±0.01 * p<0.05 by two-way ANOVA and Bonferroni post-test in skin vs oral wounds. N = 3. *Compared to 24 hr skin.
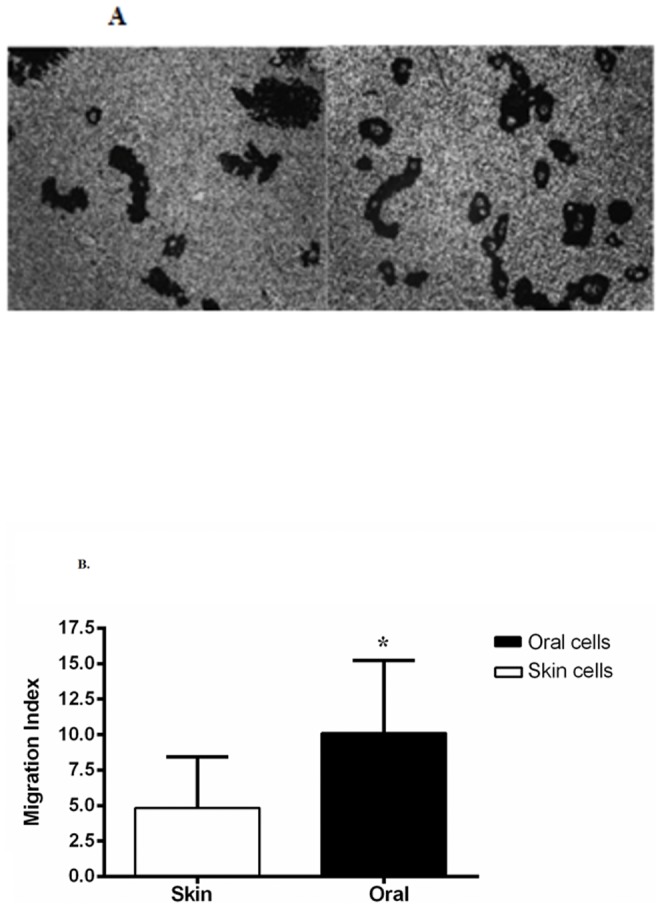
Photographs are representative examples of the tracks made by single cells. The sum of the track areas in the field was divided by the total area of the field and multiplied by 100 to yield the percentage of each field taken up by tracks. This percentage was called the migration index (MI). A) Representative migration assay slides of paired human skin and oral keratinocytes. B) Skin keratinocyte MI 5.1±1.5 and oral keratinocyte MI 13.0±2.7 respectively. Average migration fold ratio of (2.6 fold) oral/skin of N = 3 independent paired oral and skin keratinocyte migration assays.
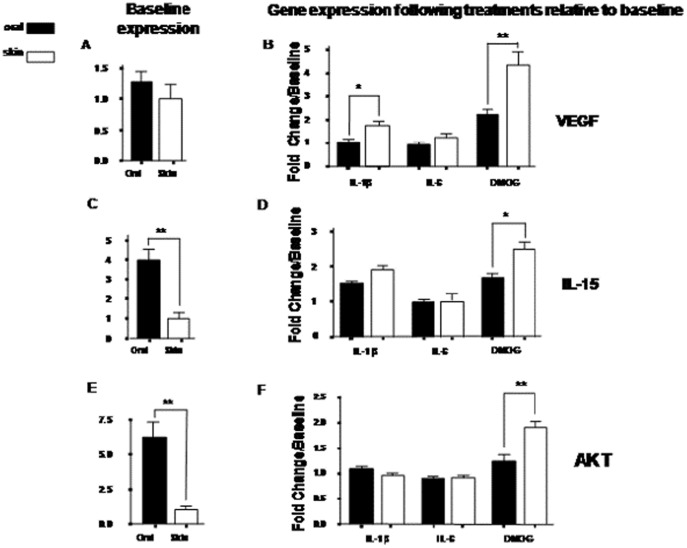
Results were based on 3 individual donors' paired skin and oral mucosal keratinocytes. A) Baseline VEGF expression in oral and skin keratinocytes by RT PCR analyses. B) Relative VEGF expression in keratinocytes following stimulation. C) Baseline IL-15 expression in oral and skin keratinocytes by RT PCR analyses. D) Relative IL-15 expression in keratinocytes following stimulation. E) Baseline AKT3 expression in oral and skin keratinocytes. F) Relative AKT3 expression in keratinocytes following stimulation.
References
-
- Asikainen TM, Ahmad A, Schneider BK, Ho WB, Arend M, et al. (2005) Stimulation of HIF-1alpha, HIF-2alpha, and VEGF by prolyl 4-hydroxylase inhibition in human lung endothelial and epithelial cells. Free Radic Biol Med 38: 1002–1013.. - PubMed
-
- Angelov N, Moutsopoulos N, Jeong M, Nares S, Ashcroft G, et al. (2004) Aberrant mucosal wound repair in the absence of secretory leukocyte protease inhibitor. Thromb Haemost 92: 288–97. - PubMed
-
- Ashcroft GS, Lei K, Jin W, Longenecker G, Kulkarni AB, et al. (2000) Secretory leukocyte protease inhibitor mediates non-redundant functions necessary for normal wound healing. Nat Med 61: 1147–53. - PubMed
-
- Bussi M, De Stefani A, Milan F, Lerda W, Ferrero V, et al. (1995) Is transposed skin transformed in major head and neck mucosal reconstruction? Acta Oto-Laryngologica. 115: 348–351. - PubMed
Publication types
MeSH terms
Grants and funding
LinkOut - more resources
Full Text Sources
Other Literature Sources
Medical
