Meta-Analysis
. 2014 Sep 9:12:150.
doi: 10.1186/s12916-014-0150-1.

Immunological markers of Plasmodium vivax exposure and immunity: a systematic review and meta-analysis

Meta-Analysis

Immunological markers of Plasmodium vivax exposure and immunity: a systematic review and meta-analysis

Julia C Cutts et al. BMC Med. .

Abstract

Background: Identifying Plasmodium vivax antigen-specific antibodies associated with P. vivax infection and protective immunity is key to the development of serosurveillance tools and vaccines for malaria. Antibody targets of P. vivax can be identified by seroepidemiological studies of individuals living in P. vivax-endemic areas, and is an important strategy given the limited ability to culture P. vivax in vitro. There have been numerous studies investigating the association between P. vivax antibody responses and P. vivax infection, but there has been no standardization of results to enable comparisons across populations.

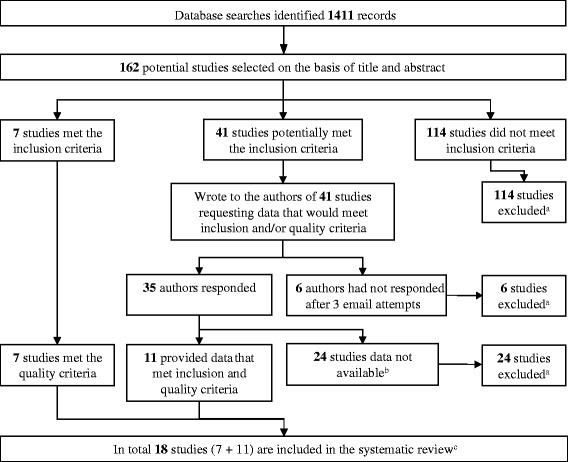
Methods: We performed a systematic review with meta-analysis of population-based, cross-sectional, case-control, and cohort studies of individuals living in P. vivax-endemic areas. We searched 6 databases and identified 18 studies that met predefined inclusion and quality criteria, and examined the association between antibody responses to P. vivax antigens and P. vivax malaria.

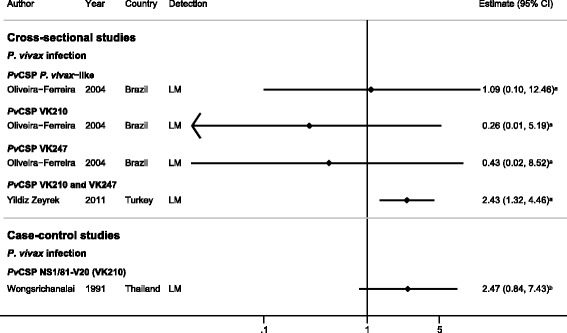
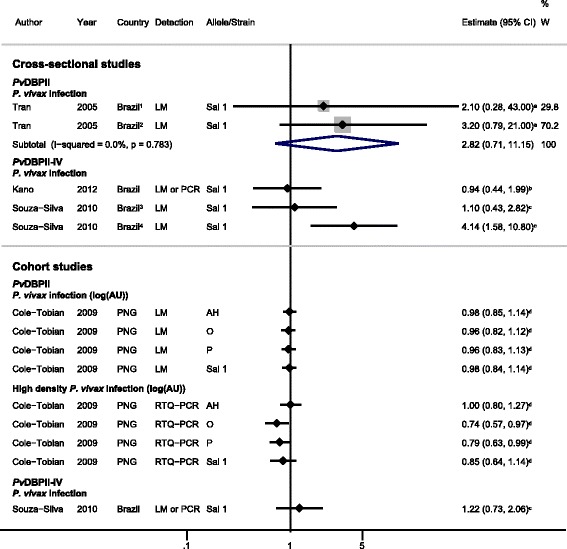
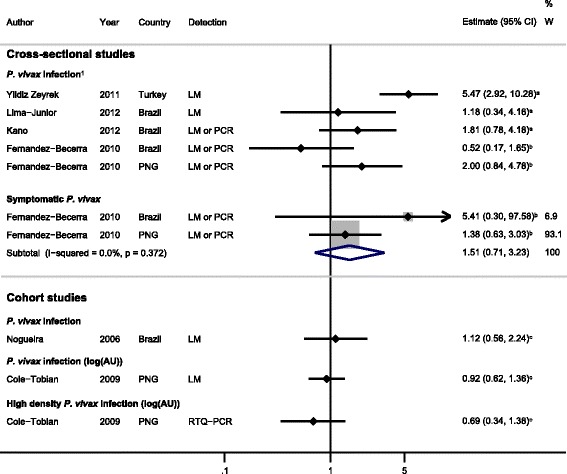
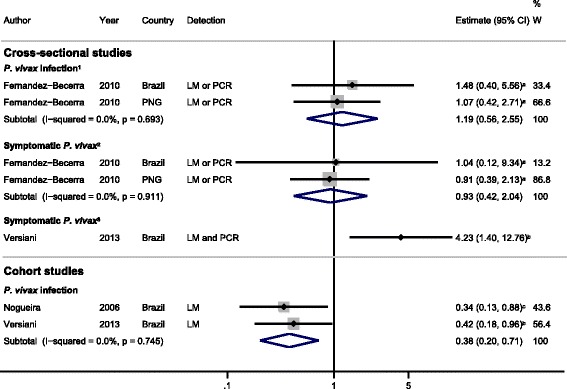
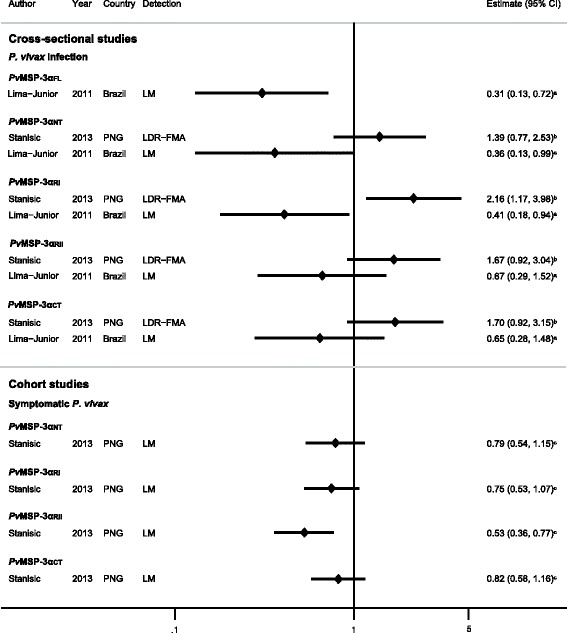
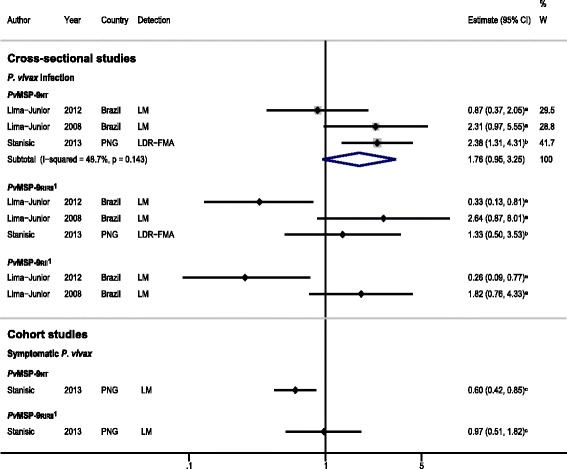
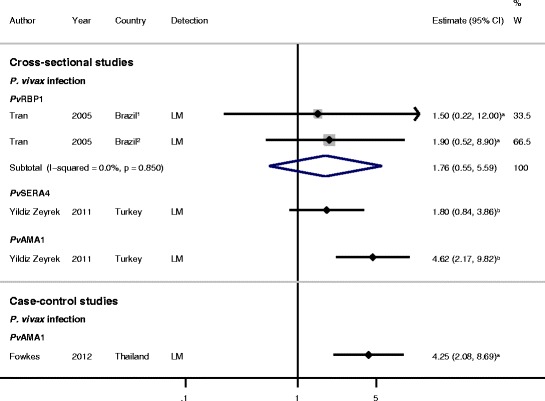
Results: The majority of studies were published in South America (all from Brazil) and the rest from geographically diverse areas in the Asia-Pacific region. Considerable heterogeneity in estimates was observed, but IgG responses to PvCSP, PvMSP-119, PvMSP-9RIRII, and PvAMA1 were associated with increased odds of P. vivax infection in geographically diverse populations. Potential sources of heterogeneity included study design, different transmission intensities and transmigrant populations. Protective associations were observed for antibodies to PvMSP-119, PvMSP-1NT, PvMSP-3α and PvMSP-9NT antigens, but only in single geographical locations.

Conclusions: This systematic review revealed several antigen-specific antibodies that were associated with active infection and protective immunity, which may be useful biomarkers. However, more studies are needed on additional antigens, particularly cohort studies to increase the body of evidence for protective immunity. More studies representing diverse geographical regions encompassing varying P. vivax endemicities are needed to validate the generalizability of the findings and to provide a solid evidence base for the use of P. vivax antigens in vaccines and serosurveillance tools.


Figures

Figure 1
Figure 1
Flow chart of study identification. aFor details of excluded studies, see Additional file 3. bData not in format for re-analysis or data not available. cThe characteristics of the included studies are given in Table 1.
Figure 2
Figure 2
Forest plot of the association of Pv CSP IgG responses with Plasmodium vivax infection. Estimates represent the odds of P. vivax infection in IgG responders compared with non-responders. aData supplied by the original authors and estimate calculated by the current authors; bpublished estimate. All estimates are unadjusted. Abbreviations: LM, light microscopy; W, weight.
Figure 3
Figure 3
Forest plot of the association of Pv DBP IgG responses with Plasmodium vivax infection. Estimates represent the estimate of P. vivax infection in IgG responders compared with non-responders, unless stated otherwise. For cross-sectional studies, the estimate is an odds ratio; for cohort studies, it is a risk ratio. 1Colina study site; 2Ribeirinha study site; 3First (baseline) survey; 4Second survey. aEstimate supplied by the original authors following correspondence; bdata supplied by the original authors and estimate calculated by the current authors; cestimate calculated by the current authors from data in the paper; dpublished estimate. All estimates are unadjusted, with the exception of estimates from Cole-Tobian et al. [34], which were adjusted for age. When I 2 was ≤30%, meta-analysis based on a fixed-effects model was conducted. Estimates for distinct alleles of PvDBPII were not combined in meta-analysis. Abbreviations: AU, antigen units; LM, light microscopy; RTQ-PCR, real-time quantitative polymerase chain reaction; PNG, Papua New Guinea; W, weight.
Figure 4
Figure 4
Forest plot of the association of Pv MSP-1 19 IgG responses with Plasmodium vivax outcomes. Estimates represent the estimate of P. vivax infection in IgG responders compared with non-responders unless stated otherwise. For cross-sectional and case–control studies, the estimate is an odds ratio; for cohort studies, it is a risk ratio. 1Meta-analysis of IgG responses to PvMSP-119 and odds of P. vivax infection (estimates from cross-sectional studies) showed a high degree of heterogeneity (I 2 = 73.8%, P = 0.004), so results were not pooled. aData supplied by the original authors, and estimate calculated by the current authors; bestimate calculated by the current authors from data in the paper; cpublished estimate. All estimates are unadjusted, with the exception of estimates from Cole-Tobian et al. [34], which were adjusted for age, and Noguiera et al. [27], which were adjusted for geographical sector. When I 2 was ≤30%, meta-analysis based on a fixed-effects model was conducted. AU, antigen units; LM, light microscopy; PCR, polymerase chain reaction; PNG, Papua New Guinea; RTQ-PCR, real-time quantitative PCR; W, weight.
Figure 5
Figure 5
Forest plot of the association of Pv MSP-1 N-terminus IgG responses with Plasmodium vivax outcomes. Estimates represent the estimate of P. vivax infection in IgG responders compared with non-responders. For cross-sectional studies, the estimate is an odds ratio; for cohort studies, it is a risk ratio. 1Symptomatic and asymptomatic P. vivax-positive individuals were compared with P. vivax-negative individuals; 2symptomatic individuals who were positive for P. vivax were compared with asymptomatic individuals who were either positive or negative for P. vivax; 3symptomatic individuals who were positive for P. vivax by both PCR and LM were compared with individuals who were negative for P. vivax by both PCR and LM. aEstimate calculated by the current authors from data in the paper; bdata supplied by the original authors and estimate calculated by the current authors; cpublished estimate. All estimates are unadjusted, with the exception of the estimate from Nogueira et al. [27], which was adjusted for geographical sector. When I 2 was ≤30%, meta-analysis based on a fixed-effects model was conducted. Abbreviations: LM, light microscopy; PNG, Papua New Guinea; W, weight.
Figure 6
Figure 6
Forest plot of the association of Pv MSP-3α IgG responses with Plasmodium vivax outcomes. Estimates represent the estimate of P. vivax infection in IgG responders compared with non-responders. For cross-sectional studies, estimate is an odds ratio; for cohort studies, it is a risk ratio. aData supplied by the original authors and estimate calculated by the current authors; bestimate calculated by the current authors from data in the paper; cpublished estimate. All estimates are unadjusted, with the exception of estimates from cohort data from Stanisic et al. [36], which were adjusted for age, season, spatial variation, and individual differences in exposure. Meta-analysis of responses to PvMSP-3αNT, PvMSP-3αRI, PvMSP-3αRII, and PvMSP-3αCT, and odds of P. vivax infection (estimates from cross-sectional studies) showed a high degree of heterogeneity (I 2 > 75% and/or P < 0.1) so estimates were not pooled. Abbreviations: LM, light microscopy; LDR-FMA, ligase detection reaction-fluorescent microsphere assay; PNG, Papua New Guinea.
Figure 7
Figure 7
Forest plot of the association of Pv MSP-9 IgG responses with P. vivax outcomes. Estimates represent the estimate of P. vivax infection in IgG responders compared with non-responders. For cross-sectional studies, the estimate is an odds ratio, for cohort studies, it is a risk ratio. aData supplied by original authors and estimate calculated by the current authors; bestimate calculated by the current authors from data in the paper; cpublished estimate. All estimates are unadjusted, with the exception of estimates from cohort data from Stanisic et al. [36], which were adjusted for age, season, spatial variation, and individual differences in exposure. 1Meta-analysis of PvMSP-9RIIRII and PvMSP-9RII with odds of P. vivax infection showed a high degree of heterogeneity (I 2 = 77.5%, P = 0.012 and 87%, P = 0.006 respectively), so results were not pooled. Abbreviations: LDR-FMA, ligase detection reaction-fluorescent microsphere assay; LM, light microscopy; PNG, Papua New Guinea; W, weight.
Figure 8
Figure 8
Forest plot of the association of Pv AMA1, Pv RBP1, and Pv SERA4 IgG responses with Plasmodium vivax infection. Estimates represent the odds of P. vivax infection in responders compared with non-responders. 1Colina study site; 2Ribeirinha study site. aEstimate supplied by original authors following correspondence; bdata supplied by original authors and estimate calculated by the current authors. All estimates are unadjusted, with the exception of the estimate from Fowkes et al. [37] which was adjusted for gravidity, trimester, and prophylaxis, and the estimates from Tran et al. [30], which were adjusted for age. When I 2 was ≤30%, meta-analysis based on a fixed-effects model was conducted. Abbreviations: LM, light microscopy; W, weight.

References

    1. Guerra CA, Howes RE, Patil AP, Gething PW, Van Boeckel TP, Temperley WH, Kabaria CW, Tatem AJ, Manh BH, Elyazar IR, Baird JK, Snow RW, Hay SI. The international limits and population at risk of Plasmodium vivax transmission in 2009. PLoS Negl Trop Dis. 2010;4:e774. doi: 10.1371/journal.pntd.0000774. - DOI - PMC - PubMed
    1. Anstey NM, Douglas NM, Poespoprodjo JR, Price RN. Plasmodium vivax: clinical spectrum, risk factors and pathogenesis. Adv Parasitol. 2012;80:151–201. doi: 10.1016/B978-0-12-397900-1.00003-7. - DOI - PubMed
    1. The malERA Consultative Group on Diagnoses and Diagnostics A research agenda for malaria eradication: diagnoses and diagnostics. PLoS Med. 2011;8:e1000396. doi: 10.1371/journal.pmed.1000396. - DOI - PMC - PubMed
    1. The malERA Consultative Group on Vaccines A research agenda for malaria eradication: vaccines. PLoS Med. 2011;8:e1000398. doi: 10.1371/journal.pmed.1000398. - DOI - PMC - PubMed
    1. WHO: Malaria Vaccine Rainbow Tables. 2014. http://www.who.int/vaccine_research/links/Rainbow/en/index.html.

Publication types

LinkOut - more resources