. 2014 Sep 8:13:207.
doi: 10.1186/1476-4598-13-207.

Twist1 expression induced by sunitinib accelerates tumor cell vasculogenic mimicry by increasing the population of CD133+ cells in triple-negative breast cancer

Affiliations

Twist1 expression induced by sunitinib accelerates tumor cell vasculogenic mimicry by increasing the population of CD133+ cells in triple-negative breast cancer

Danfang Zhang et al. Mol Cancer. .

Abstract

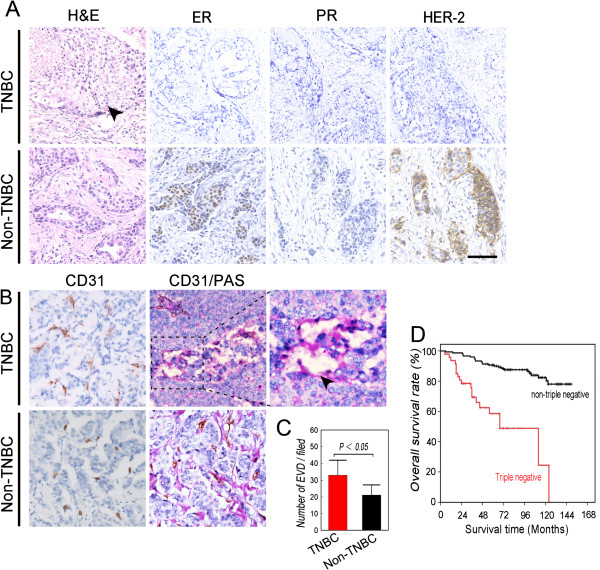
Background: Hypoxia induced by antiangiogenic agents is linked to the generation of cancer stem cells (CSCs) and treatment failure through unknown mechanisms. The generation of endothelial cell-independent microcirculation in malignant tumors is defined as tumor cell vasculogenic mimicry (VM). In the present study, we analyzed the effects of an antiangiogenic agent on VM in triple-negative breast cancer (TNBC).

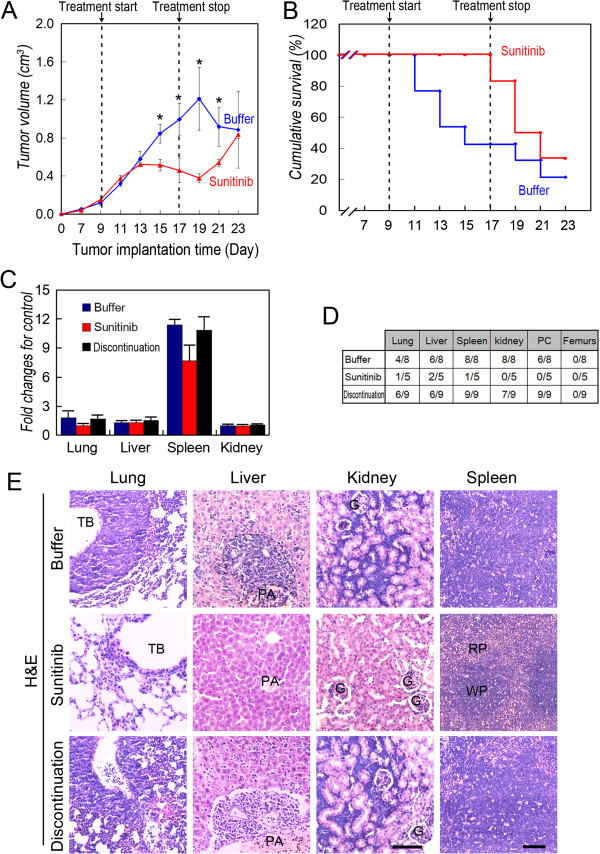
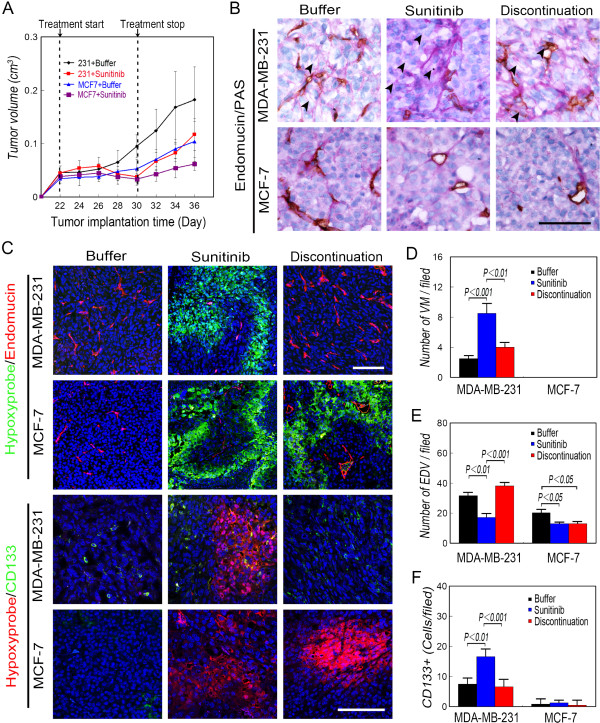
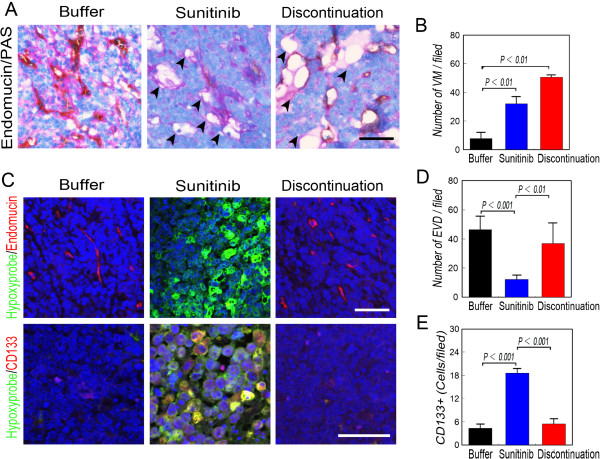
Methods: Microcirculation patterns were detected in patients with TNBC and non-TNBC. Tientsin Albino 2 (TA2) mice engrafted with mouse TNBC cells and nude mice engrafted with human breast cancer cell lines with TNBC or non-TNBC phenotypes were administered sunitinib and analyzed to determine tumor progression, survival, microcirculation, and oxygen concentration. Further, we evaluated the effects of hypoxia induced with CoCl2 and the expression levels of the transcription factor Twist1, in the presence or absence of a Twist siRNA, on the population of CD133(+) cells and VM in TNBC and non-TNBC cells.

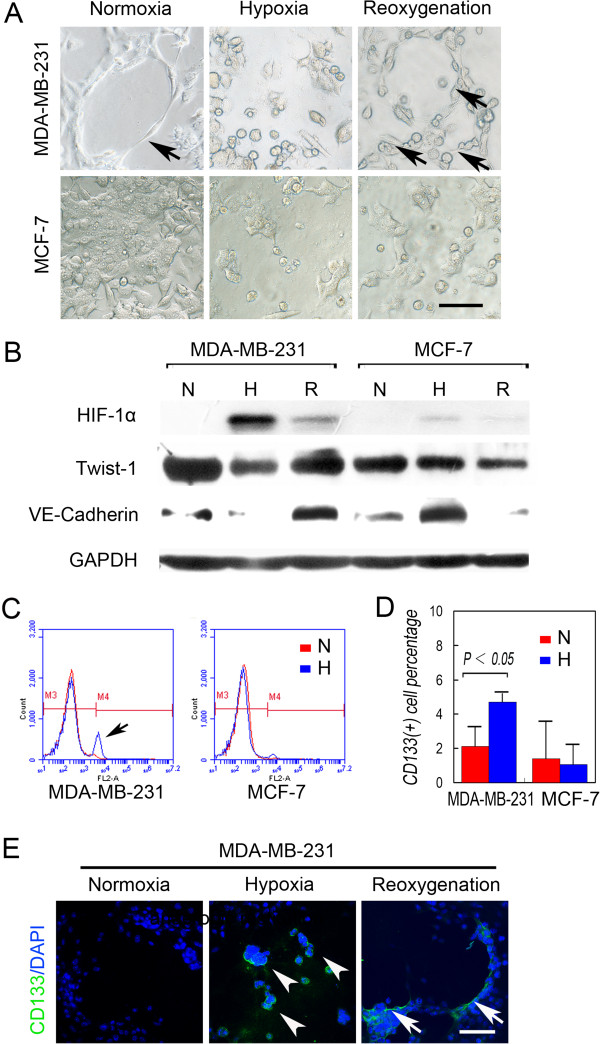
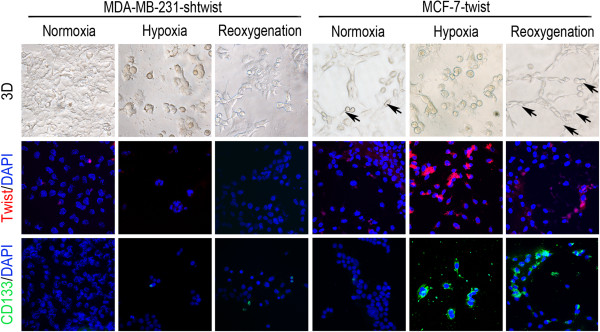
Results: VM was detected in 35.8 and 17.8% of patients with TNBC or with non-TNBC, respectively. The growth of tumors in TNBC and non-TNBC-bearing mice was inhibited by sunitinib. The tumors in TA2 mice engrafted with mouse TNBCs and in mice engrafted a human TNBC cell line (MDA-MB-231) regrew after terminating sunitinib administration. However, this effect was not observed in mice engrafted with a non-TNBC tumor cell line. Tumor metastases in sunitinib-treated TA2 mice was accelerated, and the survival of these mice decreased when sunitinib was withdrawn. VM was the major component of the microcirculation in sunitinib-treated mice with TNBC tumors, and the population of CD133+ cells increased in hypoxic areas. Hypoxia also induced MDA-MB-231 cells to express Twist1, and CD133(+) cells present in the MDA-MB-231 cell population induced VM after reoxygenation. Moreover, hypoxia did not induce MDA-MB-231 cells transfected with an sh-Twist1 siRNA cell to form VM and generate CD133(+) cells. Conversely, hypoxia induced MCF-7 cells transfected with Twist to form VM and generate CD133+ cells.

Conclusions: Sunitinib induced hypoxia in TNBCs, and Twist1 expression induced by hypoxia accelerated VM by increasing population of CD133(+) cells. VM was responsible for the regrowth of TNBCs sunitinib administration was terminated.


Figures

Figure 1
Figure 1
Characterization of the TNBC and non-TNBC groups. Patients were diagnosed with TNBC or non-TNBC using immunohistochemical criteria and group accordingly (see Methods section). A) H&E staining and IHC analysis of ER, PR, and HER2 expression in tumor sections. Tumor nests comprised poorly differentiated highly mitotic small tumor cells in patients with TNBC, and necrosis was present in the center of the tumor nests (indicated by the black arrow). B) IHC analysis of CD31 expression indicates endothelium-dependent vessels (EDV) in sections from patients with TNBC and non-TNBC. CD31/PAS double-staining shows more VM channels in TNBC sections. The arrow indicates a VM channel formed by PAS-positive matrix and tumor cells in a TNBC section. C) Comparison of the density of EDVs between groups. D) Overall survival of patients with TNBC and non-TNBC. Kaplan–Meier analysis indicates that the prognosis of the TNBC group was poorer (χ 2 = 7.587, P = 0.006). Scale bar = 100 μm. The error bar indicates the standard deviation (SD).
Figure 2
Figure 2
Effect of sunitinib on the survival, growth, and metastasis of TA2 mice with TNBC. A) Tumor growth curve of sunitinib- and placebo-treated groups (N = 20 per group). B) Survival of groups treated with sunitinib or placebo. C) Analysis of the weights of lungs, liver, spleen, and kidneys. D) Percentage of mice with metastases in different organs. More metastatic sites were identified in the lungs, liver, spleen, kidneys, and peritoneal cavity of the mice in the control group, and the number of metastases increased when treatment was terminated. E) Morphology of metastatic sites in treated and control groups (H&E staining). The scale bar = 100 μm, and the error bar indicates the SD. TB: terminal bronchiole; G: glomerulus; PA: portal area; WB: white pulp; RB: red pulp.
Figure 3
Figure 3
Effect of sunitinib on nude mice engrafted with MDA-MB-231 and MCF-7 cells. A) Tumor growth curves of (N = 20 per group). B) Microcirculation patterns. The number of EDVs decreased in sunitinib-treated mice with MDA-MB-231 tumors, and more VM channels were observed during and after these mice were treated with sunitinib compared with mice bearing MDA-MB-231-induced tumors that received placebo. The EDVs rebounded after the treatment of mice with MDA-MB-231 tumors. VM channels did not form in mice with MCF-7 tumors. The arrows indicate the VM channels formed by PAS-positive matrix and tumor cells. C) Immunofluorescence analysis of endomucin and CD133 expression and Hydroxyprobe analysis of oxygen levels. More Hypoxyprobe-positive cells were observed in the mice with tumors formed by MDA-MB-231 and MCF-7 tumors treated with sunitinib compared with those in the control group. The hypoxic area in tumors formed by MDA-MB-231 cells disappeared when treatment was terminated, and EDVs rebounded upon treatment. Conversely, there was no significant difference between mice with tumors formed by MCF-7 cells during or after treatment with sunitinib. CD133+ cells were present in MDA-MB-231 tumors in the center and periphery of the hypoxic area. The number of CD133+ cells in MCF-7 tumors did not differ among groups. D) Quantification of VM. VM channels were not observed in MCF-7 tumors. E) Quantification of EDVs. F) Quantification of CD133+ cells. More CD133+ cells were present in the MDA-MB-231 tumors in mice treated with sunitinib compared with those in other tumors. Scale bar = 100 μm, and the error bar indicates the SD.
Figure 4
Figure 4
Sunitinib-induced hypoxia accelerates the generation of CSCs and VM in breast tumors of TA2 mice. A) Microcirculation patterns of tumors in mice treated with sunitinib. The number of EDVs decreased and more VM channels were present in mice during and after treatment compared with the animals administered placebo. Numerous EDVs rebounded when treatment was discontinued. The arrows indicate the VM channels formed by PAS-positive matrix and tumor cells. B) Quantification of VM channels in the treatment groups. VM channels increased during and after sunitinib treatment. C) Immunofluorescence analysis of endomucin and CD133 expression and Hydroxyprobe analysis of oxygen levels. More tumor cells were detected using the Hypoxypobe in the tumors of mice treated with sunitinib, and most were CD133+. D) Quantification of EDVs. E) Quantification of CD133+ cells in tumors. More CD133+ cells were present in the sunitinib-treated tumors. Scale bar = 100 μm, and the error bar indicates the SD.
Figure 5
Figure 5
Hypoxia induces VM-like channel formation by up-regulating the expression of proteins associated with VM and by generating MDA-MB-231 CSCs. A) Matrigel cell culture under a CoCl2-induced hypoxia. MDA-MB-231 cells formed VM-like channels (arrow) on Matrigel under normoxia, and more VM-like channels (arrows) were formed after reoxygenation. In contrast, hypoxia and reoxygenation did not affect VM-like channel formation by MCF-7 cells. B) Western blot analysis shows that hypoxia and reoxygenation induced and inhibited HIF-1α expression, respectively, in MDA-MB-231 and MCF-7 cells. However, reoxygenation induced the expression of Twist1 and VE-cadherin only in MDA-MB-231 cells. C) Representative FACS analyses of the CD133+ populations of MDA-MB-231 and MCF-7 cells in normoxia and hypoxia. The arrow shows the increase in the CD133+ population under hypoxia. D) Quantification of the CD133+ population under normoxia and hypoxia. E) MDA-MB-231 cells formed a VM-like channel on Matrigel in normoxia and were CD133-. The MDA-MB-231 cells that survived hypoxia were spherical, similar to stem cells and expressed CD133 (arrowheads). The tumor cells that line the VM channels were CD133+ (arrows), whereas the cells far from VM were CD133-. The scale bar = 100 μm, and the error bar indicates the SD.
Figure 6
Figure 6
Effects of Twist1 levels on CD133 expression and VM-like channel formation by breast cancer cells. MDA-MB-231 cells did not form VM-like channels when Twist1 expression was inhibited under conditions of normoxia, hypoxia, and reoxygenation, and CD133 expression was inhibited as well. When Twist1 expression was up-regulated, MCF-7 cells formed VM channels under conditions of normoxia and reoxygenation. Moreover, the tumor cells that lined the VM channels were CD133+. The error bar = 100 μm, and the error bar indicates the SD.

Similar articles

Cited by

References

    1. Jemal A, Siegel R, Ward E, Hao Y, Xu J, Thun MJ. Cancer statistics, 2009. CA Cancer J Clin. 2009;59:225–249. doi: 10.3322/caac.20006. - DOI - PubMed
    1. von Minckwitz G, Untch M, Nuesch E, Loibl S, Kaufmann M, Kummel S, Fasching PA, Eiermann W, Blohmer JU, Costa SD, Mehta K, Hilfrich J, Jackisch C, Gerber B, du Bois A, Huober J, Hanusch C, Konecny G, Fett W, Stickeler E, Harbeck N, Müller V, Jüni P. Impact of treatment characteristics on response of different breast cancer phenotypes: pooled analysis of the German neo-adjuvant chemotherapy trials. Breast Cancer Res Treat. 2011;125:145–156. doi: 10.1007/s10549-010-1228-x. - DOI - PubMed
    1. Baselga J, Norton L, Albanell J, Kim YM, Mendelsohn J. Recombinant humanized anti-HER2 antibody (Herceptin) enhances the antitumor activity of paclitaxel and doxorubicin against HER2/neu overexpressing human breast cancer xenografts. Cancer Res. 1998;58:2825–2831. - PubMed
    1. Pal SK, Childs BH, Pegram M. Triple negative breast cancer: unmet medical needs. Breast Cancer Res Treat. 2011;125:627–636. doi: 10.1007/s10549-010-1293-1. - DOI - PMC - PubMed
    1. Lund MJ, Butler EN, Bumpers HL, Okoli J, Rizzo M, Hatchett N, Green VL, Brawley OW, Oprea-Ilies GM, Gabram SG. High prevalence of triple-negative tumors in an urban cancer center. Cancer. 2008;113:608–615. doi: 10.1002/cncr.23569. - DOI - PubMed

Publication types

MeSH terms