. 2014;42(17):10915-26.
doi: 10.1093/nar/gku811. Epub 2014 Sep 8.

Synonymous codon bias and functional constraint on GC3-related DNA backbone dynamics in the prokaryotic nucleoid

Affiliations

Synonymous codon bias and functional constraint on GC3-related DNA backbone dynamics in the prokaryotic nucleoid

Gregory A Babbitt et al. Nucleic Acids Res. 2014.

Abstract

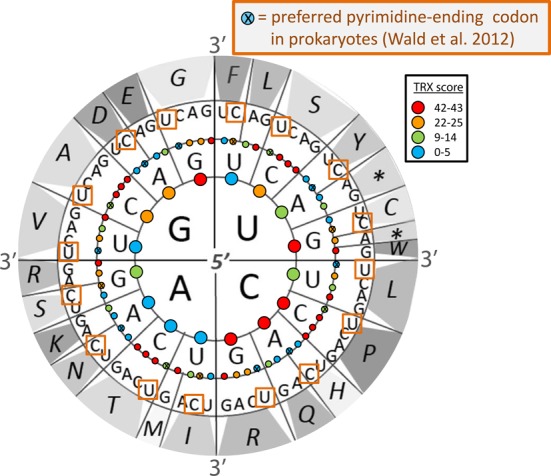
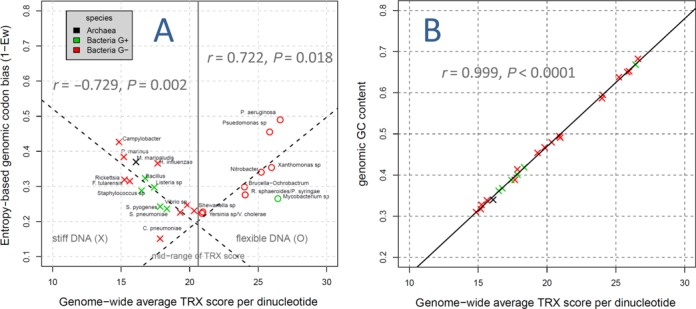
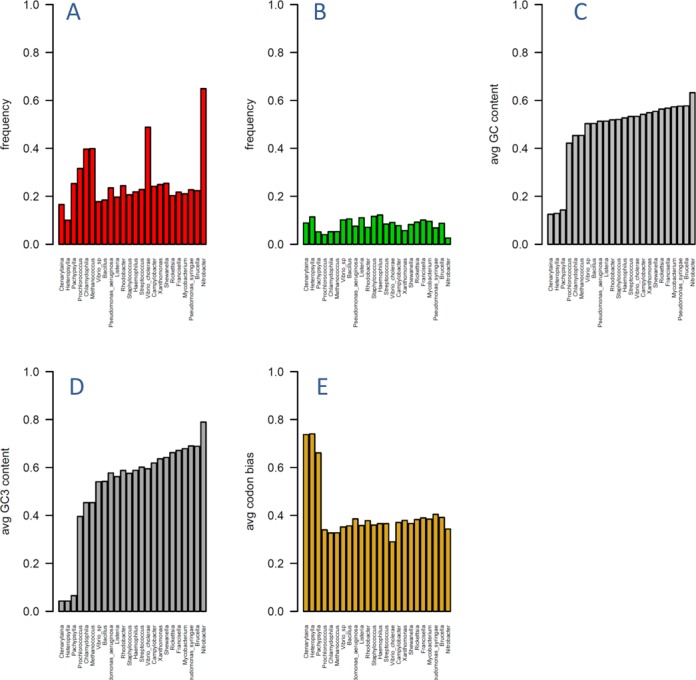
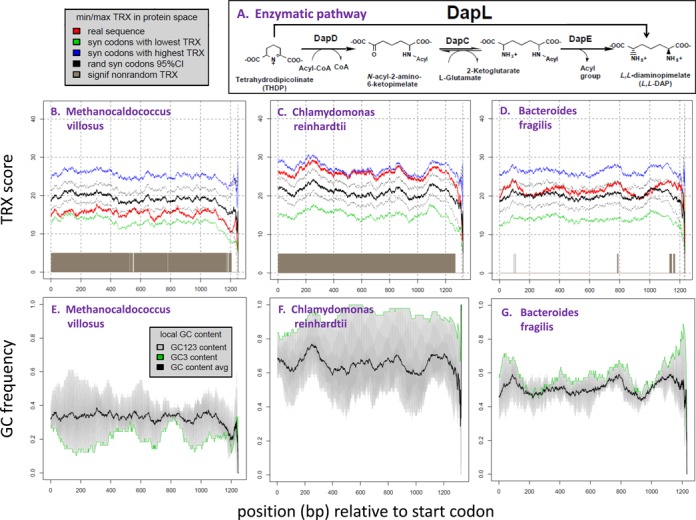
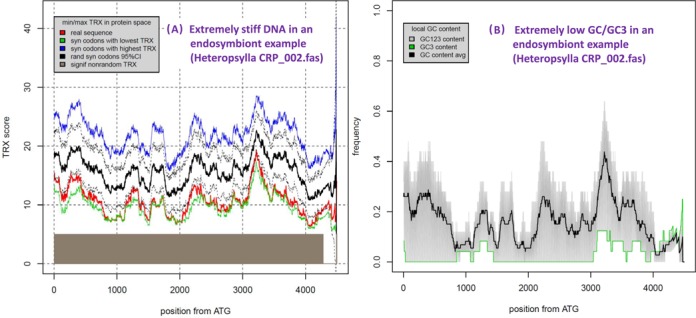
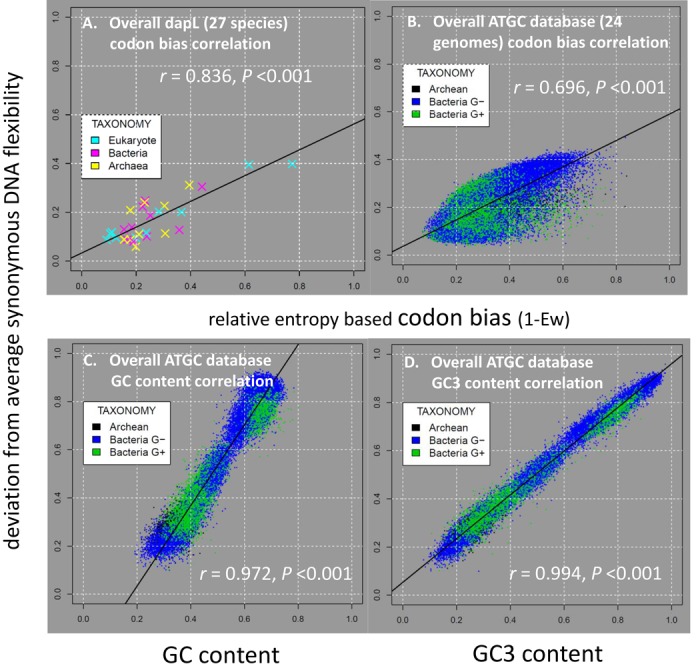
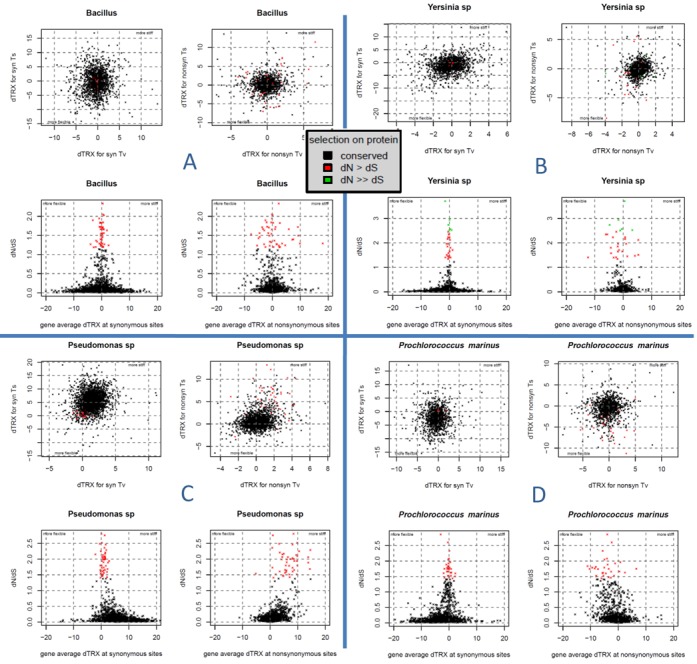
While mRNA stability has been demonstrated to control rates of translation, generating both global and local synonymous codon biases in many unicellular organisms, this explanation cannot adequately explain why codon bias strongly tracks neighboring intergene GC content; suggesting that structural dynamics of DNA might also influence codon choice. Because minor groove width is highly governed by 3-base periodicity in GC, the existence of triplet-based codons might imply a functional role for the optimization of local DNA molecular dynamics via GC content at synonymous sites (≈GC3). We confirm a strong association between GC3-related intrinsic DNA flexibility and codon bias across 24 different prokaryotic multiple whole-genome alignments. We develop a novel test of natural selection targeting synonymous sites and demonstrate that GC3-related DNA backbone dynamics have been subject to moderate selective pressure, perhaps contributing to our observation that many genes possess extreme DNA backbone dynamics for their given protein space. This dual function of codons may impose universal functional constraints affecting the evolution of synonymous and non-synonymous sites. We propose that synonymous sites may have evolved as an 'accessory' during an early expansion of a primordial genetic code, allowing for multiplexed protein coding and structural dynamic information within the same molecular context.


Figures

Figure 1.
Figure 1.
Internal phosphate linkages of codons assigned by the standard genetic code are color-coded according to their fixed levels of intrinsic DNA flexibility. The intrinsic flexibility of external phosphate linkages, located at the center and outer edge of the white circle, are variable across genes and genomes and are determined through adjacent codon usage patterns. Adapted from (28) and (29).
Figure 2.
Figure 2.
A fundamental relationship between intrinsic DNA flexibility (TRX score), genomic GC content and entropy-based codon bias. (A) Prokaryotic genomes with uncharacteristically stiff or flexible genome architecture, and thus deviating from the middle of the TRX scale, demonstrate increased codon bias. (B) The relationship between GC content and intrinsic DNA flexibility at the genomic level is particularly pronounced, reflecting the trends easily observed in the TRX scale, where flexibility increases with GC containing dinucleotides.
Figure 3.
Figure 3.
Respective frequencies of regions of the genomes under natural selection acting on intrinsic DNA flexibility (i.e. TRX score) at synonymous sites. (A) purifying selection or functional conservation of intrinsic DNA flexibility at synonymous sites and (B) positive selection or adaptive alteration of intrinsic DNA flexibility at synonymous sites. Average genomic GC, GC3 and entropy-based codon bias are also shown (C, D and E, respectively). Genes under natural selection were identified using neutral simulations of mutational impacts on TRX score. Species in all plots are ordered according to increasing genomic GC content (i.e. plot C).
Figure 4.
Figure 4.
The intrinsic DNA flexibility and GC3 of the diaminopimelate aminotransferase (DapL) gene from three representative species. (A) Reaction catalyzed by DapL showing the ability of the enzyme to circumvent the DapD, DapC and DapE steps in the Escherichia coli acyl pathways. (DapD), N-acyl-2-amino-6-ketopimelate aminotransferase (DapC), N-acyl-L,L-2,6-ketopimelate deacylase (DapE), L,L-diaminopimelate aminotransferase (DapL) (46). Example plots of smoothed flexibility (TRX) scores (B–D) are shown for (B) an Archean, Methanonocaldococcus villosus,(C) an algae, Chlamydomonas reinhardtii and (D) a bacteria, Bacteroides fragilis. Plots B and C show DapL gene TRX scores (red) that are extreme examples of inflexible and flexible genes (respectively) for their given protein space (bounded in blue and green). The black lines indicate the average synonymous TRX score and 95% CI when synonymous codons are chosen randomly (local gene regions where observed TRX is outside this CI are flagged in brown on the X axis). A dapL gene's deviation from average synonymous flexibility is achieved largely by codon usage bias. Figures E–G show respective smoothed trends in overall GC content (black), GC content in each reading frame (gray) and GC3 (green).
Figure 5.
Figure 5.
The intrinsic DNA flexibility and GC3 for a typical gene from the extreme psyllid endosymbiont, Carsonella sp in Heteropsylla. Example plots of (A) observed (red), minimum (green), maximum (blue) and average synonymous (black) intrinsic flexibility TRX scores and (B) respective trends in overall GC content (black), GC content in each reading frame (gray) and GC3 (green). Supplementary File D has plots for all known Carsonella genes.
Figure 6.
Figure 6.
The positive association (r) of entropy-based codon bias (1-Ew) and gene-level deviations from synonymous flexibility for the given protein space for (A) the 27 dapL genes and (B) all 35 234 prokaryotic genes in the ATGC database (24 genomes). Examples of the deviation from average synonymous flexibility given its protein space for single genes are shown in Figure 5B–D (i.e. the mean devTRXcdn = abs[mean red line-mean black line]/[mean blue line - mean green line]). Also shown are the positive association of (C)overall gene GC content and (D) overall gene third position GC content (GC3) with gene-level deviations from synonymous flexibility for the given protein space.
Figure 7.
Figure 7.
Fundamental constraints between protein evolution (dN/dS) and mutational impacts on intrinsic DNA flexibility (dTRX) and hence, genome architectural dynamics. Example plot sets are shown for two genomes with low codon bias (A) Bacillus and (B) Yersinia, and two genomes with extreme codon bias; (C) Pseudomonas = high GC and (D) Prochlorococcus = low GC. Within each plot set, genes functionally conserved at the protein level (i.e. low dN/dS) are shown in black, while genes adaptively altered at protein level are shown colored. Mutational impacts on flexibility (dTRX) are shown separately for synonymous sites (left side of plot set) and non-synonymous sites (right side of plot set). dTRX for transitions and transversions are separated in the upper plots of each set.

References

    1. Roth A.C., Anisimova M., Cannarrozzi G. Measuring codon usage bias. In: Cannarrozzi G, Schneider A, editors. Codon Evolution: Mechanisms and Models. Oxford: Oxford University Press; 2012. pp. 189–217.
    1. Rubenstein N.D., Pupko T. Detection and analysis of conservation at synonymous sites. In: Cannarrozzi G, Schneider A., editors. Codon Evolution: Mechanisms and Models. Oxford: Oxford University Press; 2012. pp. 218–228.
    1. Zuckerkandl E., Pauling L. Molecules as documents of evolutionary history. J. Theor. Biol. 1965;8:357–366. - PubMed
    1. Kimura M. Rate of molecular evolution considered from standpoint of population genetics. Proc. Natl. Acad. Sci. U.S.A. 1969;63:1181–1188. - PMC - PubMed
    1. Kimura M. Evolutionary rate at the molecular level. Nature. 1968;217:624–626. - PubMed

Publication types

LinkOut - more resources