. 2014;42(17):11011-24.
doi: 10.1093/nar/gku814. Epub 2014 Sep 8.

Transcriptional complexity and roles of Fra-1/AP-1 at the uPA/Plau locus in aggressive breast cancer

Affiliations

Transcriptional complexity and roles of Fra-1/AP-1 at the uPA/Plau locus in aggressive breast cancer

Gabriel Moquet-Torcy et al. Nucleic Acids Res. 2014.

Abstract

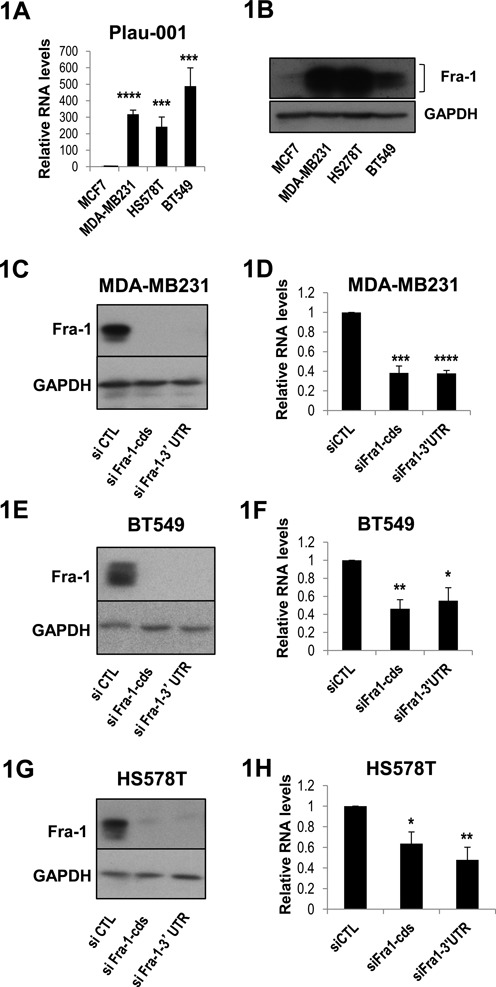
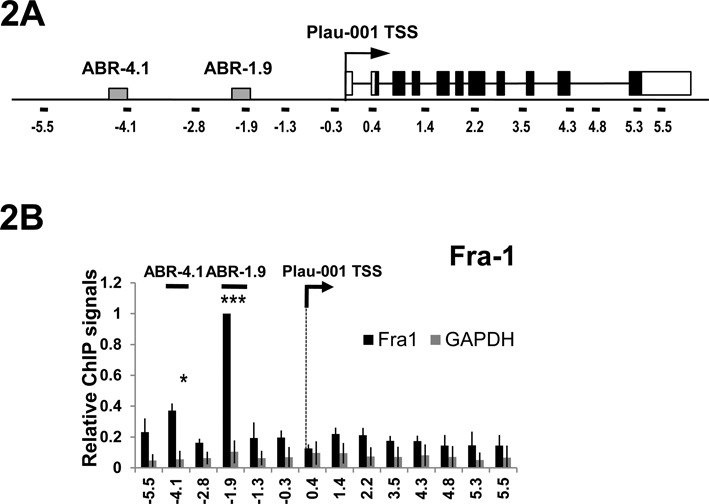
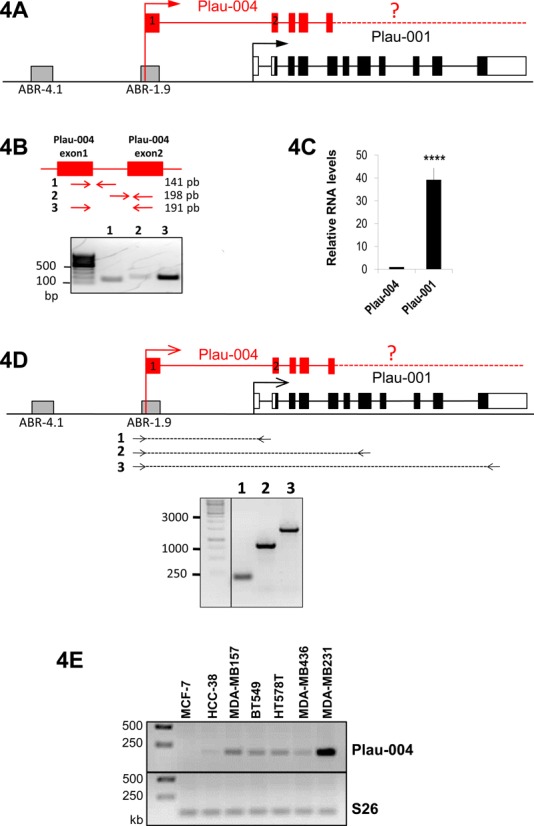
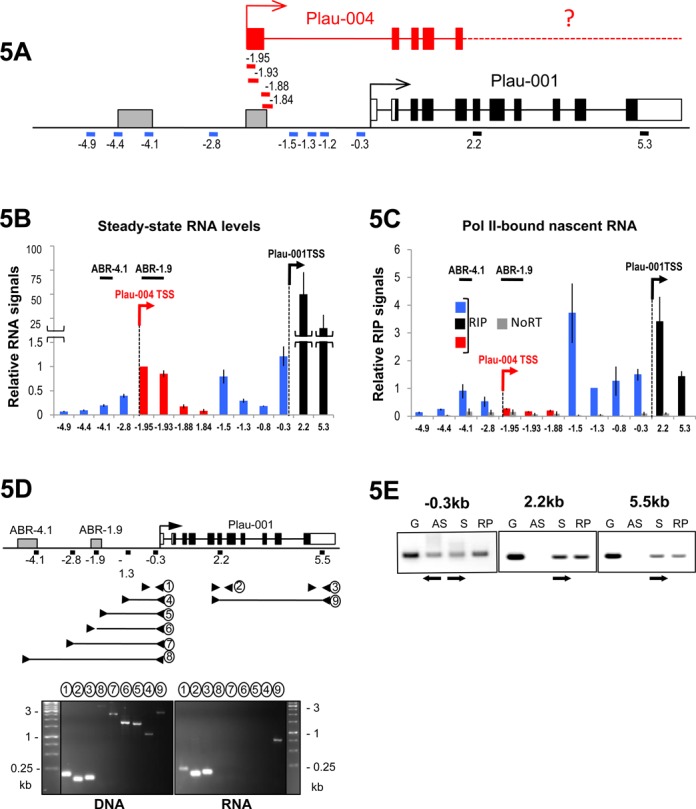
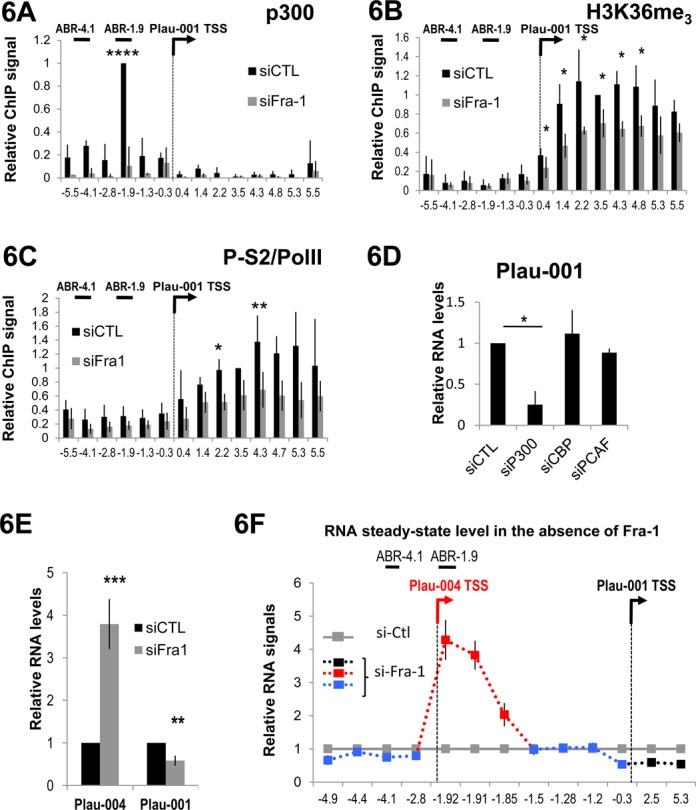
Plau codes for the urokinase-type plasminogen activator (uPA), critical in cancer metastasis. While the mechanisms driving its overexpression in tumorigenic processes are unknown, it is regulated by the AP-1 transcriptional complex in diverse situations. The AP-1 component Fra-1 being overexpressed in aggressive breast cancers, we have addressed its role in the overexpression of Plau in the highly metastatic breast cancer model cell line MDA-MB231 using ChIP, pharmacological and RNAi approaches. Plau transcription appears controlled by 2 AP-1 enhancers located -1.9 (ABR-1.9) and -4.1 kb (ABR-4.1) upstream of the transcription start site (TSS) of the uPA-coding mRNA, Plau-001, that bind Fra-1. Surprisingly, RNA Pol II is not recruited only at the Plau-001 TSS but also upstream in the ABR-1.9 and ABR-4.1 region. Most Pol II molecules transcribe short and unstable RNAs while tracking down toward the TSS, where there are converted into Plau-001 mRNA-productive species. Moreover, a minority of Pol II molecules transcribes a low abundance mRNA of unknown function called Plau-004 from the ABR-1.9 domain, whose expression is tempered by Fra-1. Thus, we unveil a heretofore-unsuspected transcriptional complexity at Plau in a reference metastatic breast cancer cell line with pleiotropic effects for Fra-1, providing novel information on AP-1 transcriptional action.


Figures

Figure 1.
Figure 1.
Control of uPA mRNA abundance by Fra-1 in ER breast cancer cell lines. (A) Relative abundances of Plau-001 mRNA in MCF-7, MDA-MB231, BT549, HS578T cells. mRNA abundances were assayed by RT-qPCR from total cellular RNA and normalized to S26 mRNA taken as an internal standard. The Plau-001/S26 mRNA ratio was arbitrarily set to 1 in MCF-7 cells. (B) Fra-1 protein levels in MCF-7, MDA-MB231, BT549 and HS578T cells. Fra-1 protein levels were compared by immunoblotting using a specific Fra-1 antiserum. Fra-1 is indicated by brackets. Glyceraldehyde-3-phosphate dehydrogenase (GAPDH) was taken as an electrophoresis loading control. (C, E, G) RNAi-mediated depletion of Fra-1 protein in MDA-MB231 (C), BT549 (E) and HS578T cells (G). Cells were transfected with either a control siRNA (siCTL) or siRNAs directed against the Fra-1 coding sequence (siFra-1-cds) or the 3′ unstranslated region (siFra-1–3′UTR) and protein contents were analyzed by immunoblotting with the relevant antibodies 48 h later. (D, F, H) Plau-001 mRNA reduction in siRNA-transfected MDA-MB231- (D), BT549- (F) and HS578T cells (H). Plau-001 mRNA was assayed by RT-qPCR 48 h post-siRNA transfection in the same cells as in C, E and F. Plau-001 mRNA abundance was arbitrarily set to 1 in siCTL-transfected cells for calculation of mean values. In A, D, F and H, values are the means of four independent experiments and error bars indicate standard deviations. Results of the Student's paired t-test are indicated on the graphs.
Figure 2.
Figure 2.
Binding of Fra-1 to the Plau locus. (A) Structure of the Plau locus. White boxes indicate Plau-001 5′UTR and 3′UTR, whereas black boxes indicate the uPA open reading frame. The arrow refers to Plau-001 TSS, as indicated in the Ensembl database. ABR-1.9 and ABR-4.1 (gray boxes) indicate Fra-1-binding regions (see text). Black lines indicate the DNA fragments (100–200 bp each) amplified by qPCR in ChIP analyses, the numbers indicating the position of their middle with respect to the TSS. (B) Fra-1 ChIP analyses. ChIP were conducted using either Fra-1-specific antibodies (black) or an anti-GAPDH antibody used as negative control (grey). Values are the means of three independent experiments and are normalized to amplicon −1.9 (containing ABR-1.9), which was arbitrarily set to 1. Primer sequences are given in Supplementary Information S1.
Figure 3.
Figure 3.
Distribution of histones, Pol II, cdk9, Trap220 and p300 on the Plau locus. ChIPs were conducted in MDA-MB231 (MDA) and MCF7 (A–D and J) cells using antibodies specific for histone H3 (A), H3K4me3 (B), H3K9ac (C), RBP1- (Pol II) (D and H), phospho-Ser5 (E), phospho-Ser2 RBP1 CTD (F), cdk9 (G), Trapp220/Med1 (I) and p300 (J). (H) ChIP conducted using an antibody against RNA Pol II in MDA-MB231 cells treated, or not, with DRB (65 μM) for 4 h. Values are the mean of at least three experiments. For calculation of means, all values were normalized to that of amplicon −1.9 in MDA-MB231 cells, which was arbitrarily set to 1, except for (i) H3K4me3 and H3K9ac where values were normalized to that of amplicon −1.3 set to 1 and (ii) P-S2 where values were normalized to that of amplicon 3.5 set to 1. In the case of (H), normalization was achieved with respect to control conditions. Bars indicate standard deviation. Results of the Student's paired t-test are indicated on the graphs.
Figure 4.
Figure 4.
Plau-001 and Plau-004 mRNAs in MDA-MB231 cells. (A) Structure of the Plau locus: Plau-001 is depicted as in Figure 2A. Plau-004 is depicted as described in the ENSEMBL.org database. The dashed line and the question mark indicate that its 3′ end has not been characterized. (B) Plau-004 mRNA expression in MDA-MB231 cells. The sketch represents Plau-004 exon 1 and 2. Amplicon 1 and 2 correspond to non-spliced RNA, whereas amplicon 3 corresponds to spliced RNA. RT-PCR products from total MDA-MB231 cells were analyzed by agarose gel electrophoresis. (C) Relative abundances of Plau-001 and Plau-004 in MDA-MB231 cells. RNA abundances were assayed by RT-qPCR from total cellular RNA. RNA levels were normalized to that for S26 and the value for Plau-004/S26 was set to 1. (D) Plau-004 contains Plau-001 3′UTR. Reverse transcription was performed using total RNA from MDA-MB231 cells and random primers. PCRs were then carried out using a 5′ primer located in Plau-004 exon 1 and 3 downstream primers located at different positions in the uPA locus as depicted in the figure. PCR products were analyzed by agarose gel electrophoresis. (E) Expression of Plau-004 in different aggressive breast cancer cell lines. Total RNA was prepared from various breast cancer cell lines, which all express substantial amounts of Fra-1 and uPA mRNA except MCF-7. RT-PCR products corresponding to amplicon 3, as described in (B), were analyzed by agarose gel electrophoresis.
Figure 5.
Figure 5.
Pol II tracking at the Plau locus in MDA-MB231 cells. (A) Structure of the Plau locus. Black lines indicate RT-qPCR amplicons corresponding to coding sequences included in the Plau-001 mRNA. Blue lines indicate RT-qPCR amplicons corresponding to either intervening sequences not included in spliced Plau-004 mRNA or sequences lying upstream of ABR-1.9. Red lines indicate RT-qPCR amplicons whose 5′ end are located within Plau-004 exon 1 and whose 3′ ends are located within either Plau-004 exon 1 (−1.95 and −1.93 kb; i.e. amplicons included in Plau-004 mRNA) or at the beginning of Plau-004 first intervening sequence (−1.88 and −1.84 kb; i.e. amplicons not included in the spliced Plau-004 mRNA). Amplicons were all of small sizes (60–100 nt). (B) Steady-state levels of RNA transcripts upstream of Plau-001 TSS. RT-qPCRs were carried out as in Figure 4C using total RNA from MDA-MB231 cells. The color code is the same as in (A). (C) Assay of RNA Pol II-associated RNA (RIP). RNA bound to immunoprecipitated Pol II were purified as described in Materials and Methods. After reverse transcription using random primers, RT-qPCRs were conducted using the amplicons depicted in A to assess the relative abundances of nascent RNAs at different positions on the uPA locus. The color code is the same as in A and B. (D) Short RNA transcripts between ABR-1.9 and Plau-001 TSS. DNA and total RNA were prepared from MDA-MB231 cells, which was followed by reverse transcription of RNA using random primers. Amplicons of different sizes and positions were amplified by PCR as depicted in the upper panel of the figure and then analyzed by electrophoresis through agarose gels. Amplification products obtained with genomic DNA are presented in the left lower panel and permitted to validate the use of the selected amplification oligonucleotides. RT-PCR products are presented in the right lower panel. Fragments 2, 3 and 9 correspond to Plau-001 mRNA. Only fragment 1 (163 bp) could be amplified between Plau-001 and ABR-1.9. (E) Bidirectional transcription upstream of Plau-001 TSS. Total RNA from MDA-MB231 cells was prepared. Reverse transcriptions were carried out under three conditions: (i) random primers as a positive control not discriminating sense or antisense transcription, (ii) sense primers to visualize antisense transcription and (iii) antisense primers to visualize sense transcription. Oriented reverse transcriptions were initiated at positions −0.3 (upstream of Plau-001 TSS), +2.2 (within Plau-001 exon 6) or +5.5 kb (within Plau-001 3′ UTR). PCRs (30 cycles) were then performed using the same above-described sense and antisense primers plus appropriate primers allowing to generate 160, 193 and 110 bp amplicons, respectively, which were subsequently analyzed by agarose gel electrophoresis. Genomic DNA (G) was used as a positive control of amplification. S and AS refer to sense and antisense transcription, respectively, whereas RP refers to reverse transcription with random primers not discriminating sense and antisense transcription. Antisense transcription was found only upstream of Plau-001 TSS.
Figure 6.
Figure 6.
Effect of Fra-1 knockdown on the uPA locus. (A and B) Distribution of p300 and H3K36me3 on the Plau locus. ChIPs were conducted in MDA-MB231 cells 48 h after transfection of either a control siRNA (siCTL) or of the anti-Fra-1-cds siRNA using specific antibodies directed to p300 (A) and H3K36me3 (B). (C) P-S2/Pol II ratio at the Plau locus. ChIPs were conducted as in A and B but using antibodies directed against Pol II (RBP1 subunit) or phosphorylated Ser-2 of the RPB1 CTD. The P-S2/Pol II ratio are presented. Values are the mean of 3 (A) and 4 (B and C) experiments. For calculation of means, p300 values were normalized to that of amplicon −1.9 which was arbitrarily set to 1 in control condition. Those of H3K36me3 and P-S2 and Pol II were normalized to that of amplicon 3.5 set to 1 in control conditions (P-values are 0.052, 0.059 and 0.06 at positions +3.5, +4.7 and +5.3 kb). (D) Relative abundance of Plau-001 upon transfection of the control siRNA or of siRNA directed to p300, CBP or pCAF. Forty-eight hours after transfection, RT-qPCR were carried as in Figure 1D. Plau-001 mRNA abundance was arbitrarily set to 1 in siCTL-transfected cells for calculation of mean values. Values are the mean of three independent experiments. (E) Relative abundances of Plau-001 and Plau-004 transcripts in the absence of Fra-1. RT-qPCRs were carried out as in Figure 4C using total RNA from MDA-MB231 cells transfected with either a control siRNA (siCTL) or the anti-Fra-1-cds siRNA. RNA levels were normalized to that for S26 and the values for Plau-004/S26 and Plau-001/S26 in control condition were set to 1, as Plau-004 abundance is weak compared to that of Plau-001. Values are the means of three independent experiments. For (A), (B), (C), (D) and (E), bars indicate standard deviations. Results of the Student's paired t-test are indicated on the graphs. (F) Relative steady-state abundances of transcripts upstream and downstream of Plau-001 TSS in the absence of Fra-1. MDA-MB231 cells were transfected for 48 h with a control siRNA (siCTL) or with the anti-Fra-1-cds siRNA. RT-qPCR analyses were carried out as in Figure 5B. RNA levels were normalized to that of the invariant S26 mRNA. The value for each point is given relative to that of the control set to 1. The color code is the same as in Figure 5A–C. The data are the average of three independent experiments. The bars indicate standard deviations.

Similar articles

Cited by

References

    1. Blasi F., Sidenius N. The urokinase receptor: focused cell surface proteolysis, cell adhesion and signaling. FEBS Lett. 2010;584:1923–1930. - PubMed
    1. Lamy P.-J., Romieu G., Jacot W. [UPA/PAI-1: a tool for breast cancer treatment individualization. Biology, clinical implications and quantification assays] Bull. Cancer (Paris) 2010;97:341–348. - PubMed
    1. Smith H.W., Marshall C.J. Regulation of cell signalling by uPAR. Nat. Rev. Mol. Cell Biol. 2010;11:23–36. - PubMed
    1. Harbeck N., Schmitt M., Meisner C., Friedel C., Untch M., Schmidt M., Sweep C.G.J., Lisboa B.W., Lux M.P., Beck T., et al. Ten-year analysis of the prospective multicentre Chemo-N0 trial validates American Society of Clinical Oncology (ASCO)-recommended biomarkers uPA and PAI-1 for therapy decision making in node-negative breast cancer patients. Eur. J. Cancer Oxf. Engl. 1990. 2013;49:1825–1835. - PubMed
    1. Cirillo G., Casalino L., Vallone D., Caracciolo A., De Cesare D., Verde P. Role of distinct mitogen-activated protein kinase pathways and cooperation between Ets-2, ATF-2, and Jun family members in human urokinase-type plasminogen activator gene induction by interleukin-1 and tetradecanoyl phorbol acetate. Mol. Cell. Biol. 1999;19:6240–6252. - PMC - PubMed

Publication types

MeSH terms