. 2014 Nov;29(9):1039-47.
doi: 10.1016/j.clinbiomech.2014.08.007. Epub 2014 Aug 23.

Individuals with transtibial limb loss use interlimb force asymmetries to maintain multi-directional reactive balance control

Affiliations

Individuals with transtibial limb loss use interlimb force asymmetries to maintain multi-directional reactive balance control

Darren Bolger et al. Clin Biomech (Bristol). 2014 Nov.

Abstract

Background: Deficits in balance control are one of the most common and serious mobility challenges facing individuals with lower limb loss. Yet, dynamic postural balance control among individuals with lower limb loss remains poorly understood. Here we examined the kinematics and kinetics of dynamic balance in individuals with unilateral transtibial limb loss.

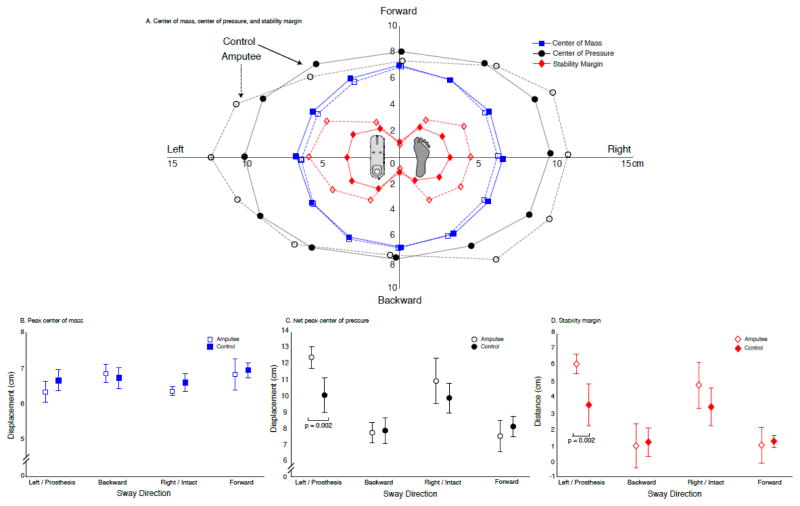
Methods: Five individuals with unilateral transtibial limb loss, and five age- and gender-matched controls completed a series of randomly applied multi-directional support surface translations. Whole-body metrics, e.g. peak center-of-mass displacement and net center-of-pressure displacement were compared across cohorts. Stability margin was computed as the difference between peak center-of-pressure and center-of-mass displacement. Additionally, center-of-pressure and ground reaction force magnitude and direction were compared between the prosthetic, intact, and control legs.

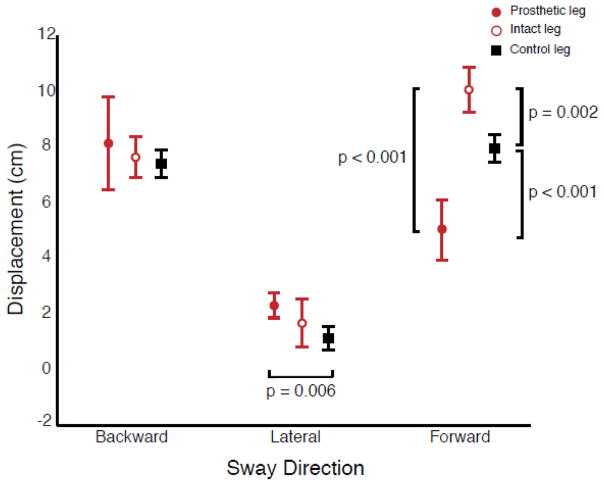
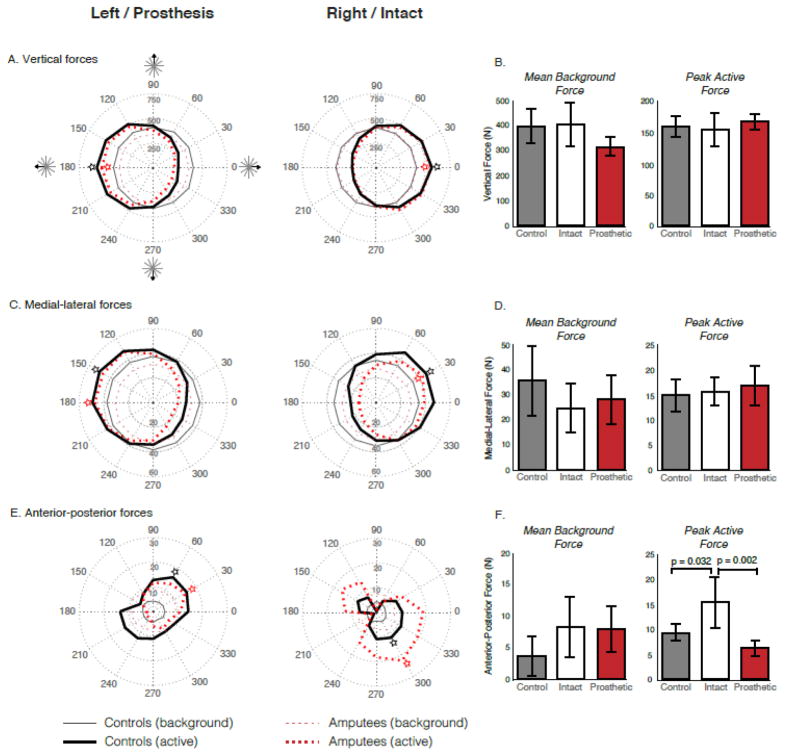
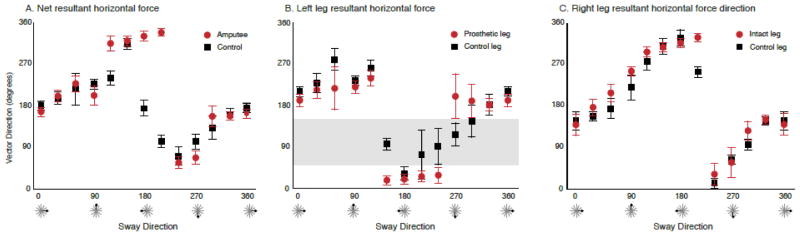
Findings: Peak center-of-mass displacement and stability margin did not differ between individuals with transtibial limb loss and controls for all perturbation directions except those loading only the prosthetic leg; in such cases the stability margin was actually larger than controls. Despite similar center-of-mass displacement, greater center-of-pressure displacement was observed in the intact leg during anterior-posterior perturbations, and under the prosthetic leg in medial-lateral perturbations. Further, in the prosthetic leg, ground reaction forces were smaller and spanned fewer directions.

Interpretation: Deficits in balance control among individuals with transtibial limb loss may be due to their inability to use their prosthetic leg to generate forces that are equal in magnitude and direction to those of unimpaired adults. Targeting this force-generating deficit through technological or rehabilitation innovations may improve balance control.

Keywords: Amputee; Artificial limb; Feedback; Ground reaction force; Posture; Stability.


Figures

Figure 1
Figure 1
Reactive postural response paradigm. A: Coordinate system for support surface translations in 12 evenly spaced directions along the horizontal plane with corresponding sway directions. B: Example of postural responses in the right leg to a forward translation of the support surface. Ground reaction forces, center of pressure, and center of mass displacement were examined during the active force production period, 160–300 ms after platform onset, of the automatic postural response (shaded area).
Figure 2
Figure 2
Whole-body reactive balance responses to multi-directional support surface translations. A: Peak center of mass displacement (blue squares), peak net center of pressure excursion (black circles), and stability margin (red diamonds) averaged across subjects (transtibial amputees: unfilled; controls: filled) for all 12 sway directions. B: Peak center of mass displacement (mean ± 1SD) across the four cardinal directions for transtibial amputees (unfilled) and controls (filled). There was no significant difference in the magnitude of whole-body displacement between individuals with limb loss and controls, or across directions within either cohort. C: Peak net center of pressure excursion (mean ± 1SD) across the four cardinal directions for individuals with transtibial limb loss (unfilled) and controls (filled). Individuals with transtibial limb loss had significantly larger net center of pressure excursion in response to lateral sway that loaded the prosthetic leg (p = 0.002) than controls. D: Stability margin (mean ± 1SD) across the four cardinal directions for individuals with transtibial limb loss (unfilled) and controls (filled). Individuals with transtibial limb loss had a significantly larger stability margin during lateral sway that loaded the prosthetic leg (p = 0.002) than controls.
Figure 3
Figure 3
Leg specific peak center of pressure excursion (mean ± 1SD) for the prosthetic (filled circle), intact (unfilled circle), and control (filled square) legs. Peak center of pressure excursion on the intact leg of individuals with transtibial limb loss was significantly greater than that of the prosthetic (p < 0.001) and control (p = 0.002) legs during forward sway. Additionally, peak center of pressure excursion during lateral sway towards the prosthetic leg was significantly larger than in controls (p = 0.006) when the comparable leg was loaded.
Figure 4
Figure 4
Background and active period ground reaction forces. A, C, E: Polar plots for each leg depicting the mean background (thin lines) and active period (thick lines) vertical (A), medial-lateral (B), and anterior-posterior (C) ground reaction force for controls (solid black lines) and individuals with transtibial limb loss (dashed red lines) across each direction of sway. B, D, F: Mean background force (± 1SD) and peak active force (± 1SD) along the vertical (B), medial-lateral (D), and anterior-posterior (F) axes for the control (grey), intact (white) and prosthetic (red) legs. Polar plots reveal a non-significant difference in vertical (prosthetic vs. control leg), medial-lateral (prosthetic vs. control; intact vs. control), and anterior-posterior (prosthetic vs. control; intact vs. control) background forces. The patterns of active forces were largely comparable between controls and individuals with transtibial limb loss along the vertical and medial-lateral axes, with no significant differences in the peak active forces. The patterns of active forces were vastly different between cohorts along the anterior-posterior axis, with significant differences between the control and intact leg (p = 0.032), as well as the intact and prosthetic leg (p = 0.002). Peak active forces were generally exerted in the same direction by controls and individuals with transtibial limb loss (denoted by star).
Figure 5
Figure 5
Direction of resultant horizontal force vectors. A: Direction (mean ± 1SD) of the net resultant horizontal force vectors for each of the 12 sway directions. The direction of the net resultant horizontal force vectors was similar between controls (black squares) and individuals with transtibial limb loss (red circles) across sway directions, the main exception being sway in the direction of the prosthesis (leftward). B: Direction (mean ± 1SD) of the resultant horizontal force vector exerted by the prosthetic (red circles) and left leg of controls (black squares). Controls exerted forces across a wider range of directions than individuals with transtibial limb loss who tended to constrain the forces they exerted with their prosthetic leg to two principle directions, approximately 180 and 0 degrees. Note that individuals with transtibial limb loss did not exert forces with their prosthetic leg across a range of directions, namely 45 to 160 degrees (shaded area). C: Direction (mean ± 1SD) of the resultant horizontal force vector exerted by the intact leg of individuals with transtibial limb loss (red circles) and right leg of controls (black squares). Note that the direction of the resultant horizontal force vectors was virtually equivalent across all sway directions.

References

    1. Jayakaran P, Johnson GM, Sullivan SJ, Nitz JC. Instrumented measurement of balance and postural control in individuals with lower limb amputation. Int J of Rehabil Res. 2012;35:187–196. - PubMed
    1. Miller WC, Speechley M, Deathe B. The prevalence and risk factors of falling and fear of falling among lower extremity amputees. Arch Phys Med Rehab. 2001;82:1031–1037. - PubMed
    1. Ülger Ö, Topuz S, Bayramlar K. Risk factors, frequency, and causes of falling in geriatric persons who has had a limb removed by amputation. Top Geriatr Rehabil. 2010;26:156–163.
    1. van Velzen JM, van Bennekom CA, Polomski W, Slootman JR, van der Woude LH, Houdijk H. Physical capacity and walking ability after lower limb amputation: a systematic review. Clin Rehabil. 2006;20:999–1016. - PubMed
    1. McWhinnie DL, Gordon AC, Collin J. Rehabilitation outcome 5 years after 100 lower-limb amputations. Br J Surg. 1994;81:1596–1599. - PubMed

Publication types