. 2014 Oct 15;193(8):4095-106.
doi: 10.4049/jimmunol.1401192. Epub 2014 Sep 8.

IL-1R1 signaling regulates CXCL12-mediated T cell localization and fate within the central nervous system during West Nile Virus encephalitis

Affiliations

IL-1R1 signaling regulates CXCL12-mediated T cell localization and fate within the central nervous system during West Nile Virus encephalitis

Douglas M Durrant et al. J Immunol. .

Abstract

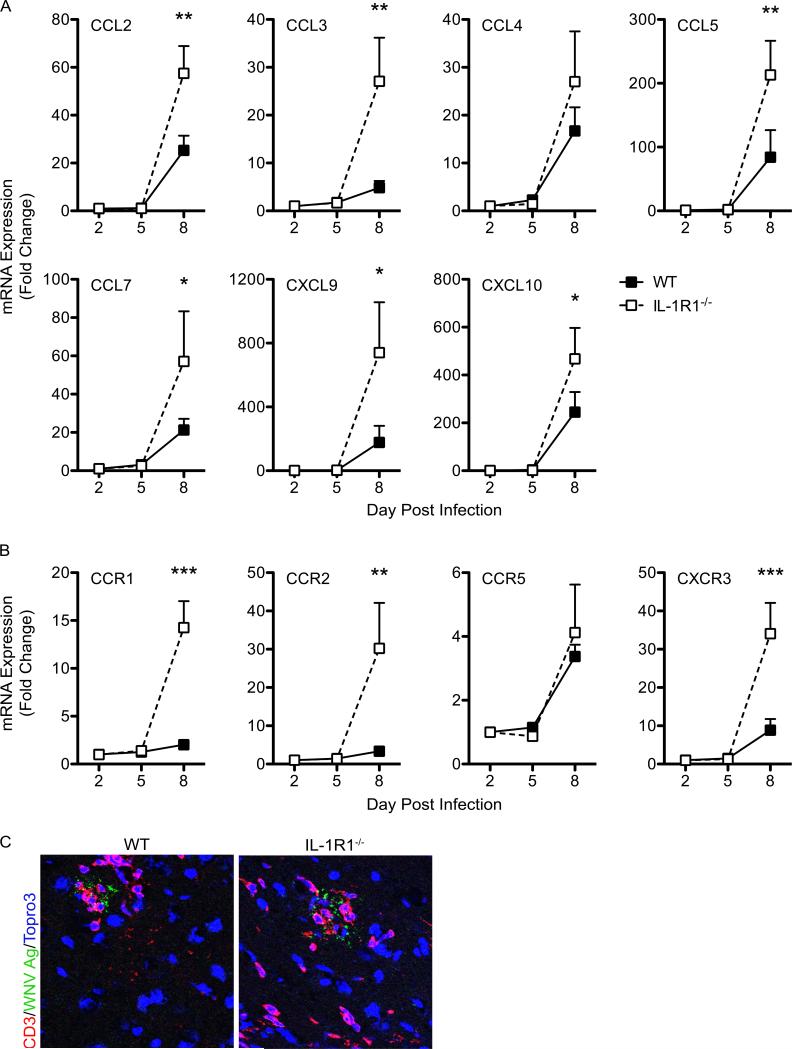
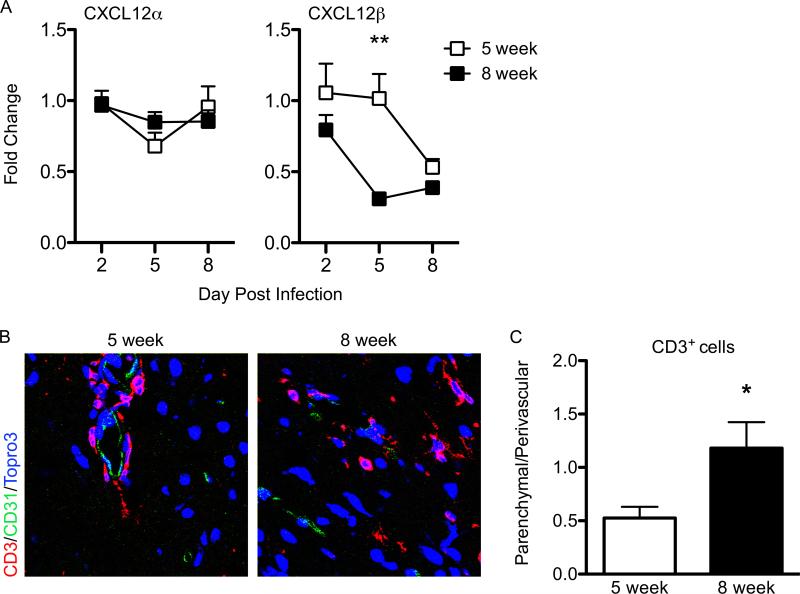
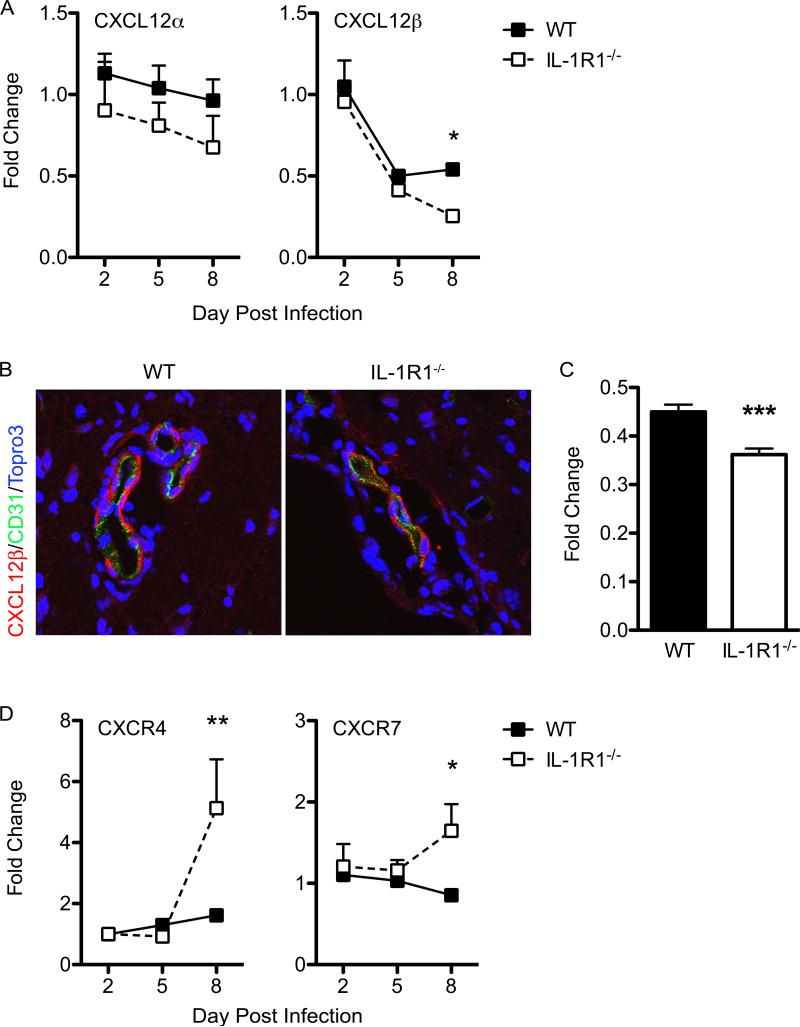
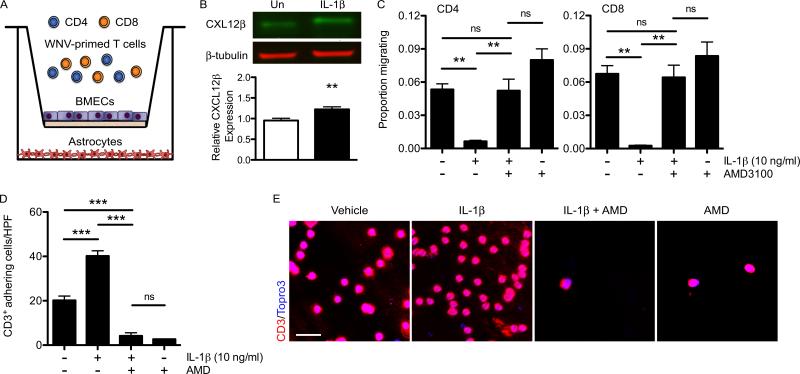
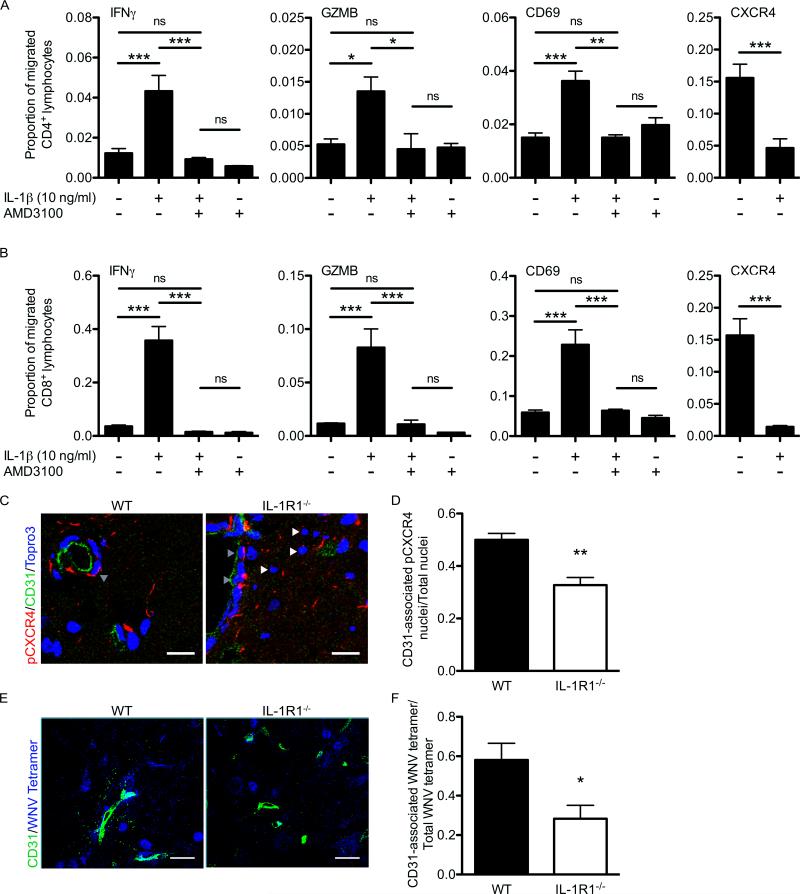
Immune cell entry into the virally infected CNS is vital for promoting viral clearance yet may contribute to neuropathology if not rigorously regulated. We previously showed that signaling through IL-1R1 is critical for effector T cell reactivation and virologic control within the CNS during murine West Nile virus (WNV) encephalitis. WNV-infected IL-1R1(-/-) mice also display increased parenchymal penetration of CD8(+) T cells despite lack of CD4-mediated full activation, suggesting dysregulation of molecular components of CNS immune privilege. In this study, we show that IL-1 signaling regulates the CNS entry of virus-specific lymphocytes, promoting protective immune responses to CNS viral infections that limit immunopathology. Analysis of blood-brain barrier function in the WNV-infected IL-1R1(-/-) mice revealed no alterations in permeability. However, parenchymal proinflammatory chemokine expression, including CCL2, CCL5, and CXCL10, was significantly upregulated, whereas microvasculature CXCL12 expression was significantly decreased in the absence of IL-1 signaling. We show that during WNV infection, CD11b(+)CD45(hi) infiltrating cells (macrophages) are the primary producers of IL-1β within the CNS and, through the use of an in vitro blood-brain barrier model, that IL-1β promotes CXCR4-mediated T cell adhesion to brain microvasculature endothelial cells. Of interest, IFNγ(+) and CD69(+) WNV-primed T cells were able to overcome CXCL12-mediated adhesion via downregulation of CXCR4. These data indicate that infiltrating IL-1β-producing leukocytes contribute to cellular interactions at endothelial barriers that impart protective CNS inflammation by regulating the parenchymal entry of CXCR4(+) virus-specific T cells during WNV infection.


Figures

Figure 1
Figure 1. IL-1 signaling regulates virologic control and leukocyte trafficking within the CNS
Examination of viral load and leukocyte entry in WT and IL-1R1−/− animals. 8-wk-old mice were infected with 100 PFU WNV via footpad injection. (A) Viral loads in the brain were assessed from WT (closed squares) or IL-1R1−/− mice (open squares) by Taqman based qRT-PCR on days 6 and 8 after infection using specific primers and probes to WNV envelope protein. (B-E) Leukocyte infiltration into the CNS was assessed by flow cytometry at days 6 and 8 post-infection (p.i.) with WNV. Total number of cells (B) recovered from perfused whole brain were stained with antibodies to CD4 (C), CD8 (D), and CD11b (E) and analyzed after gating on leukocyte population. (F, G) Histological analysis from day 8 p.i. brain tissue sections from WNV-infected mice. (F) Representative confocal microscopic images of CD3 (red) and CD31 (green) from the cerebral cortex of WT (left) and IL-1R1−/− (right) sections. Bars, 25 μm. (G) Quantitative analyses of parenchymal versus perivascular T cells within the brains of WNV-infected mice at day 8 p.i. Data are presented as a ratio of T cell location as determined by analyzing the associations of CD3+ cells with respect to CD31-stained vessels and counting the number of parenchymal versus perivascular cells in 10-15 low power confocal images for 4-6 mice per group. Data are shown as the mean ± S.E.M. for n = 4-6 mice per time point and is representative of 2-3 independent experiments. **p<0.001, ***p<0.0005.
Figure 2
Figure 2. IL-1β is primarily produced by infiltrating macrophages during WNV encephalitis
Examination of IL-1β production in the CNS of WT animals during WNV infection. Brains were harvested and analyzed by flow cytometry at day 8 p.i. with WNV and assessed for IL-1β expression by intracellular staining. (A) Representative histograms with percentages of CD4, CD8, CD11c, CD11b+CD45lo (microglia) and CD11b+CD45hi (macrophage) populations expressing IL-1β are shown. (B) Total number of IL-1β-expressing CD45+ leukocytes. (C) Total numbers of the indicated populations expressing IL-1β. Data are shown as the mean ± S.E.M. for n = 4-6 mice and is representative of 3 independent experiments.
Figure 3
Figure 3. Inflammatory chemokine signaling is increased in the absence of IL-1 signaling within the CNS during WNV infection
Examination of inflammatory chemokine expression in the CNS. Brain tissue was harvested following cardiac perfusion from WNV-infected WT (closed squares) and IL-1R1−/− mice (open squares) at indicated time points and chemokine (A) and chemokine receptor (B) mRNA levels were analyzed via qRT-PCR, normalized to GAPDH and are presented as the mean fold change in mRNA levels over uninfected controls. Statistical significance of increased chemokine expression in WNV-infected IL-1R1−/− mice was determined in comparison with infected WT mice. (C) Representative confocal microscopic images from brain sections (brainstem region) from wild-type (left) and IL-1R1−/− (right) WNV-infected mice stained for WNV antigen (green), CD3 (red) and nuclei (blue). Images are representative of results from five independent mice. Data are averages of results for at least 4 mice per group and reflect at least two independent experiments and presented as mean values ± S.E.M. *p<0.05, **p<0.01, ***p<0.001
Figure 4
Figure 4. Neuroglial activation is increased in the absence of IL-1 signaling during WNV encephalitis
Histological analysis of glial activation in the CNS of WT or IL-1R1−/− mice. Brain tissues from WNV-infected mice were collected on day 8 p.i. Confocal analysis of (A) GFAP (red) and CD3 (green) expression from cerbral cortex and of (C) IBA-1 (red) and CD3 (green) expression from brainstem of WT (left) and IL-1R1−/− mice (right). Quantitative analysis of GFAP (B) and IBA-1 (D) in both WT and IL-1R1−/− mice. Representative images shown are from 4-5 mice per group. Data are from at least 2 experiments in which 10 images were analyzed in each of the mice and presented as mean values ± S.E.M. *p<0.05 Bars, 25 μm.
Figure 5
Figure 5. CXCL12 expression in the CNS during WNV encepahlits in 5-week old animals versus 8-week old animals
(A) qRT-PCR analysis of CXCL12 expression in the CNS at indicated time points after infection with WNV in 5-week old WT (open squares) and 8-week old WT animals (closed squares). Data are mean values ± S.E.M. for n = 6 mice per group/per day across 3 independent experiments. (B) Confocal immunohistochemical analysis of brain tissue collected from WNV-infected 5-week old (left) and WNV-infected 8-week old (right) mice on day 6 p.i. Images were stained for CD3 (red), CD31 (green), and nuclei (blue). Representative images are shown for five sections from three mice in two separate experiments. (C) Quantitiave analyses of perivascular versus parenchymal T cells within brains of WNV-infected 5-week old (open bar) and 8-week old (closed bar) mice day 8 after infection. Data are presented as average percentages of T cells as determined by analyzing the associations of CD3+ cells with respect to CD31-stained vessels and counting the numbers of perivascular versus parenchymal cells in 10-12 low power confocal images for 4-5 mice per group. *p<0.05, **p<0.01
Figure 6
Figure 6. IL-1 signaling is critical for regulating CXCL12 expression in the CNS during WNV infection
Assessment of homeostatic chemokine expression in the CNS. Following cardiac perfusion, brain tissue was harvested and analyzed from WNV-infected WT (closed squares) and IL-1R1−/− mice (open squares) at indicated time points for CXCL12α/β (A), CXCR4, and CXCR7 (E) mRNA via qRT-PCR, normalized to GAPDH, and are presented as the mean fold change in mRNA levels over uninfected controls. Statistical significance of increased or decreased chemokine expression in WNV-infected IL-1R1−/− mice was determined in comparison with infected WT mice. Data are averages of results for at least 4 mice and reflect at least two independent experiments. (B) Confocal analysis of CXCL12β (red) and CD31 (green) expression from brainstem region of WNV-infected WT (left) and IL-1R1−/− mice (right) collected on day 8 p.i. (C) Quantitative analysis of CXCL12β expression in both WT and IL-1R1−/− mice brain tissue. Representative images are shown from 3 experiments in which 8-10 images were analyzed from 4-5 mice per group. *p<0.05, **p<0.01, ***p<0.001
Figure 7
Figure 7. IL-1 signaling mediates lymphocyte adhesion at BMECs via CXCR4-CXCL12 interaction
BMECs isolated from WT animals were used to generate an in vitro BBB model to assess WNV-primed T lymphocyte migration. (A) Schematic deptiction of in vitro BBB. Spleens were harvested from WNV-infected WT mice on day 6 p.i. Isolated leukocytes were restimulated ex vivo with I-Ab–restricted NS32066, NS31616 and Db-restricted NS4B peptides for 4 hrs. CD4+ and CD8+ T lymphocytes were positively selected and 5×10⁵ cells (~60% CD4+ and ~40% CD8+ T cells) were added to coculture transwell system. The apical side of the transwell filter was seeded with 105 primary WT BMECs and 105 WT primary astrocytes were seeded in the bottom of 12-well plates. (B) CXCL12β protein expression analyzed via western blot in untreated (Un) or in IL-1β (10ng/ml) treated brain microvascular endothelial cell (BMEC) lysates. Data from 2 experiments with triplicates are presented as the relative expression after β-tubulin normalization. (C) Quantification of CD4+ or CD8+ lymphocytes collected in bottom chamber 6 hrs following addition to top chamber and analyzed by flow cytometry for respective surface markers. IL-1β (10 ng/ml) was added to both chambers of in vitro BBB culture 12 hrs before lymphocte addition and AMD3100 (5 μg/ml) was added to isolated CD4+ and CD8+ lymphocytes. The data are quantified as the number of CD4+ or CD8+ lymphocytes present in the bottom chamber after 6h divided by the total number of that cell type added to the top chamber (proportion migrating). (D) Quantitation of the number of CD3+ lymphocytes adhering to the basal side of the endothelial cell inserts. (E) CD3 adhesion was determined by visualing filter membranes labeled with CD3 (red) and nuclei (blue) and imaged by confocal microscopy. Data from 4 independent experiments in which 5 images were analyzed in each of three replicates per treatment group and are presented as mean values ± S.E.M. *p<0.05, **p<0.01, ***p<0.001, ns, not significant
Figure 8
Figure 8. IL-1 signaling is required for effectual T lymphocyte entry in the CNS of West Nile virus infected mice
T lymphocytes that migrated through the coculutre transwell system or the in vitro BBB were analyzed for activation markers via flow cytometry. (A, B) Quantitation of the number of IFN-γ, GZMB, CD69, and CXCR4 expressing CD4+ (A) or CD8+ (B) lymphocytes collected from the bottom chamber of untreated and IL-1β, AMD3100, or IL-1β and AMD3100 treated transwell coculture systems and divided by the total number of CD4+ or CD8+ lymphocytes present in the bottom chamber and expressed as proportion migrated. Data are shown as mean ± S.E.M. for 2 independent experiments in each of three replicates per treatment group. (C) Confocal analysis of pCXCR4 (red) and CD31 (green) expression from brainstem region of WNV-infected WT (left) and IL-1R1−/− mice (right) collected on day 8 p.i. Representative images are shown from 2-3 experiments in which 8-10 images were analyzed from 4-5 mice per group. Bars, 25 μm. (D) Quantitative analyses of CD31-associated nuclei versus total nuclei within the brains of WNV-infected mice at day 8 p.i. (E) In situ tetramer staining for WNV-specific CD8+ T cells (blue) along with CD31 (green) was analyzed by confocal microscopy. Representative images are shown. Bars, 25 μm. (F) Quantitative analyses of CD31-associated WNV-tetramer labelled cells versus total WNV-tetramer within the brains of WNV-infected mice at day 8 p.i. Data are presented as a ratio in which 10-15 low-power confocal images were analyzed in each of the mice and presented as mean ± S.E.M. *p<0.05, **p<0.01, ***p<0.001

References

    1. Engelhardt B, Coisne C. Fluids and barriers of the CNS establish immune privilege by confining immune surveillance to a two-walled castle moat surrounding the CNS castle. Fluids Barriers CNS. 2011;8:4. - PMC - PubMed
    1. McCandless EE, Piccio L, Woerner BM, Schmidt RE, Rubin JB, Cross AH, Klein RS. Pathological expression of CXCL12 at the blood-brain barrier correlates with severity of multiple sclerosis. Am J Pathol. 2008;172:799–808. - PMC - PubMed
    1. McCandless EE, Wang Q, Woerner BM, Harper JM, Klein RS. CXCL12 limits inflammation by localizing mononuclear infiltrates to the perivascular space during experimental autoimmune encephalomyelitis. J Immunol. 2006;177:8053–8064. - PubMed
    1. McCandless EE, Zhang B, Diamond MS, Klein RS. CXCR4 antagonism increases T cell trafficking in the central nervous system and improves survival from West Nile virus encephalitis. Proc Natl Acad Sci U S A. 2008;105:11270–11275. - PMC - PubMed
    1. Bouffard JP, Riudavets MA, Holman R, Rushing EJ. Neuropathology of the brain and spinal cord in human West Nile virus infection. Clinical neuropathology. 2004;23:59–61. - PubMed

Publication types

MeSH terms