. 2014 Oct 15;193(8):3902-13.
doi: 10.4049/jimmunol.1302998. Epub 2014 Sep 8.

Ligation of TLR5 promotes myeloid cell infiltration and differentiation into mature osteoclasts in rheumatoid arthritis and experimental arthritis

Affiliations

Ligation of TLR5 promotes myeloid cell infiltration and differentiation into mature osteoclasts in rheumatoid arthritis and experimental arthritis

Seung-Jae Kim et al. J Immunol. .

Abstract

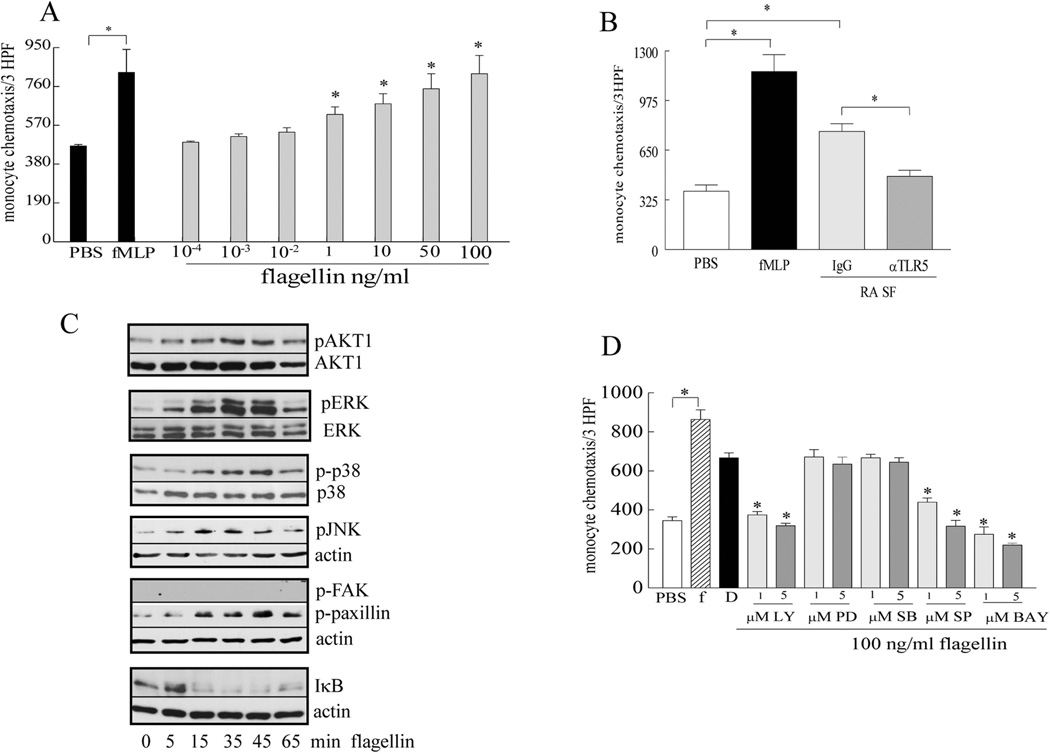
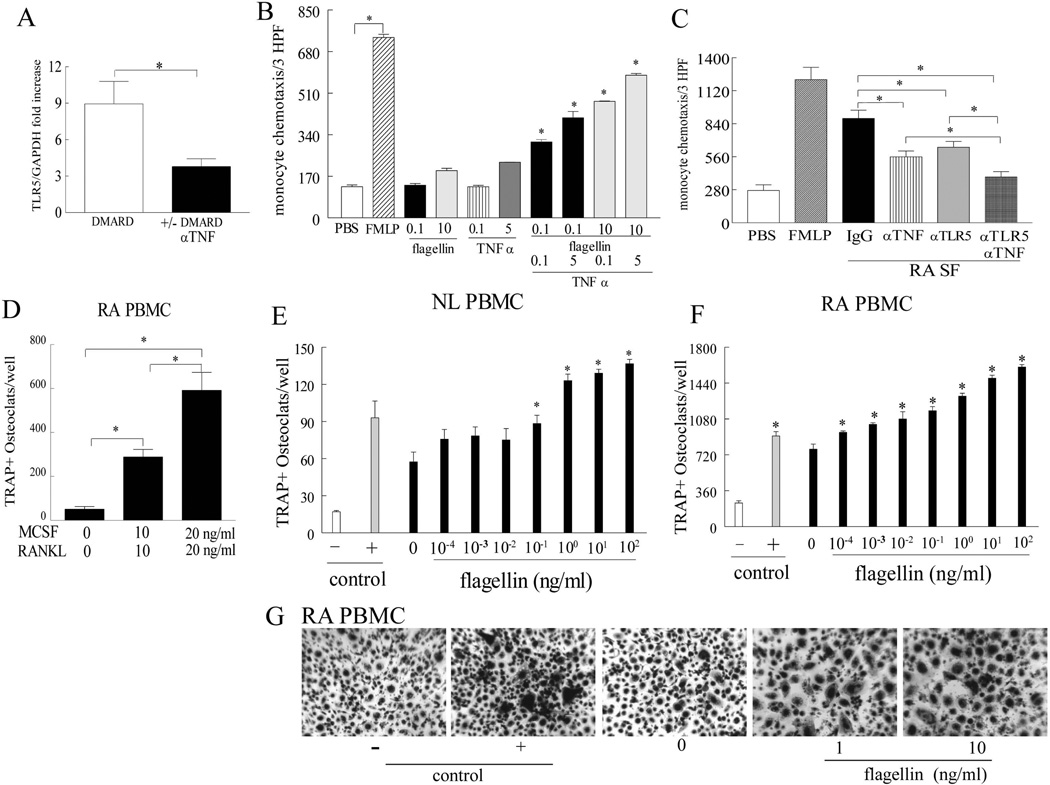
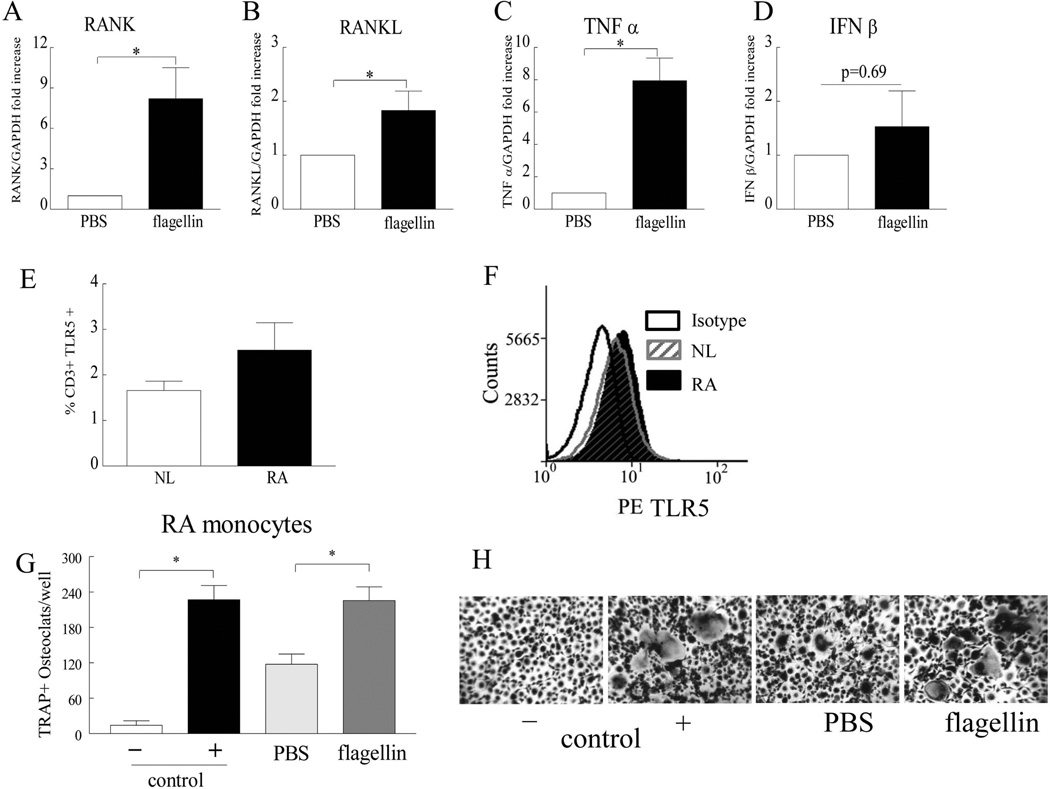
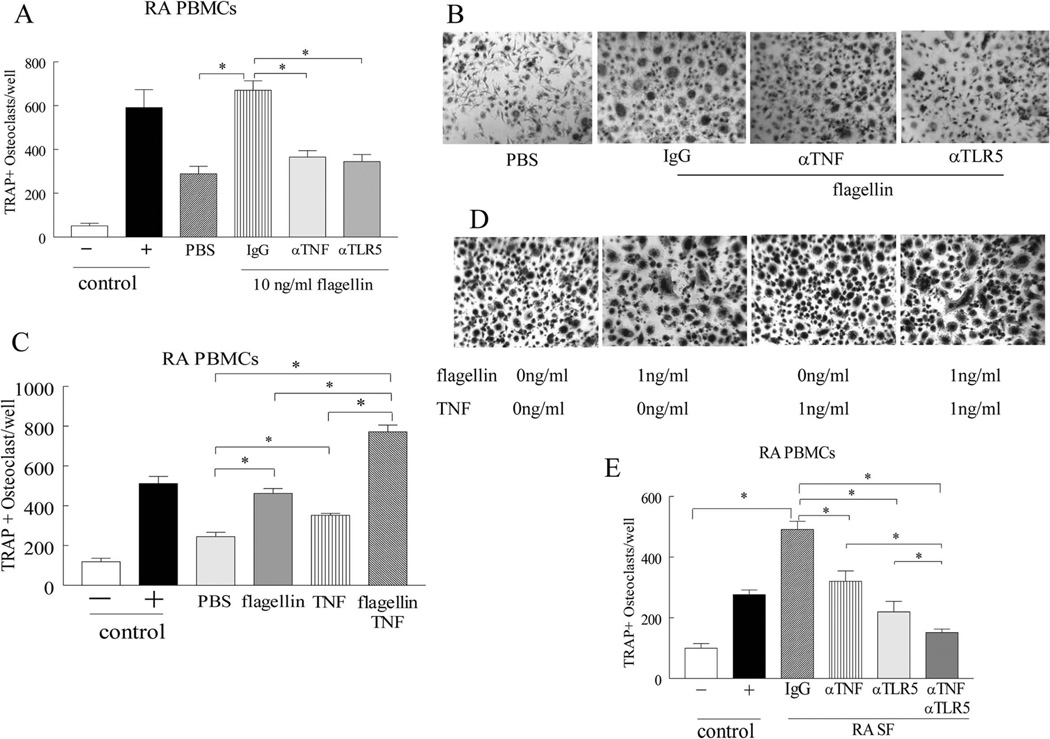
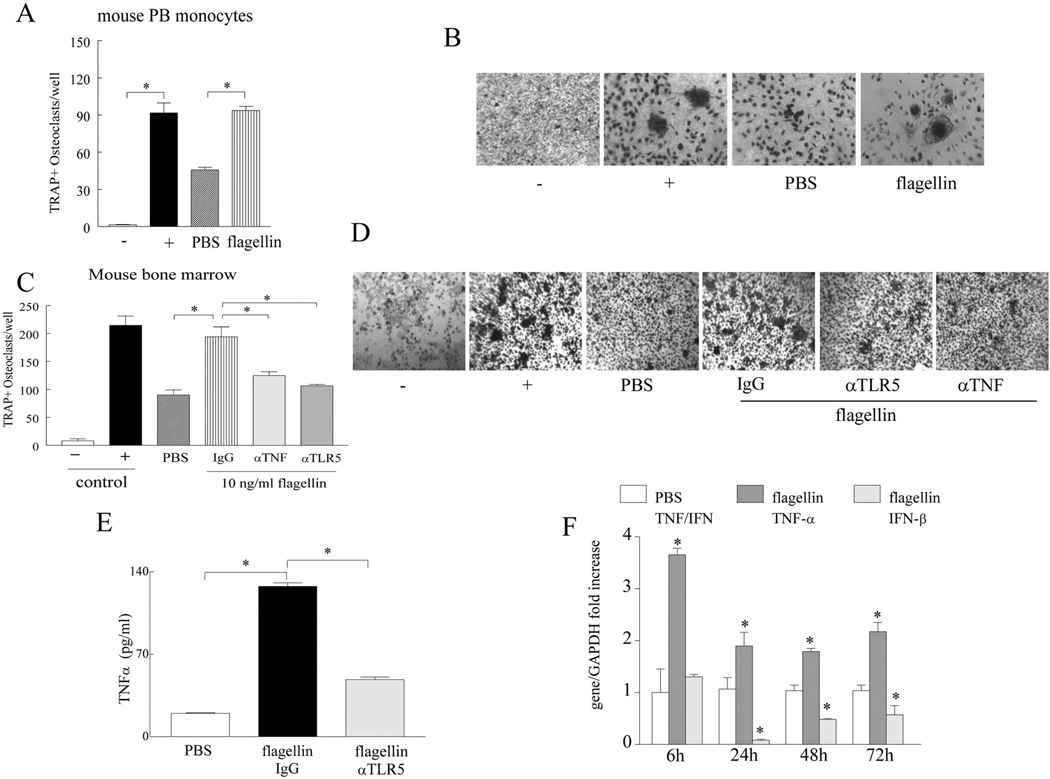
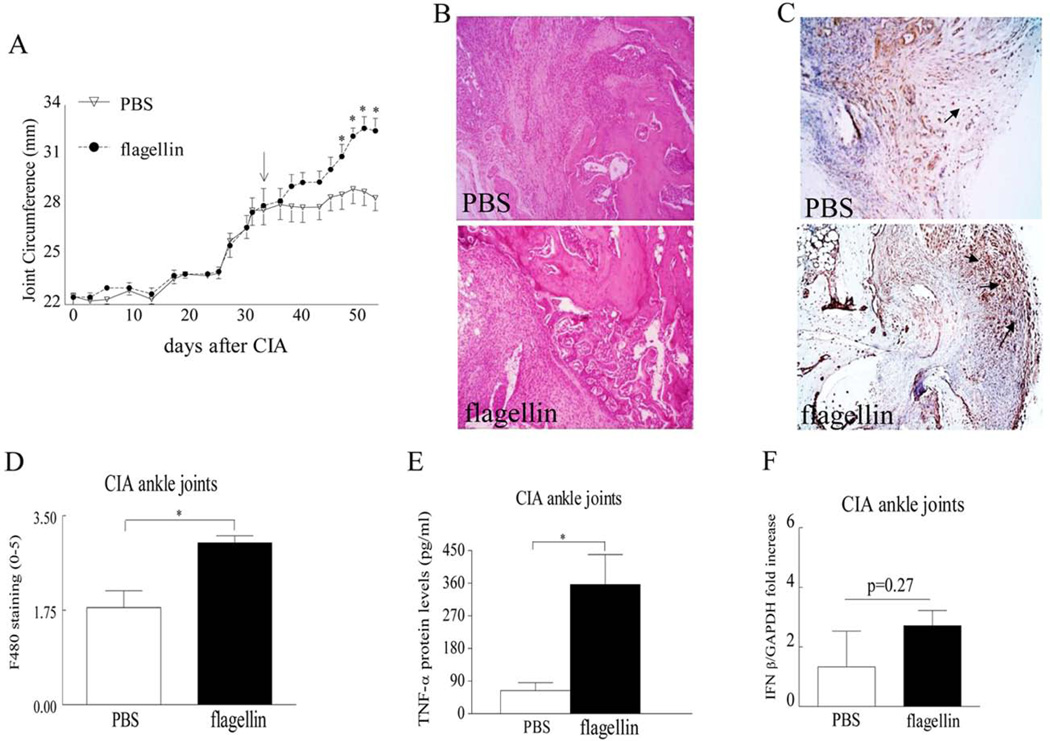
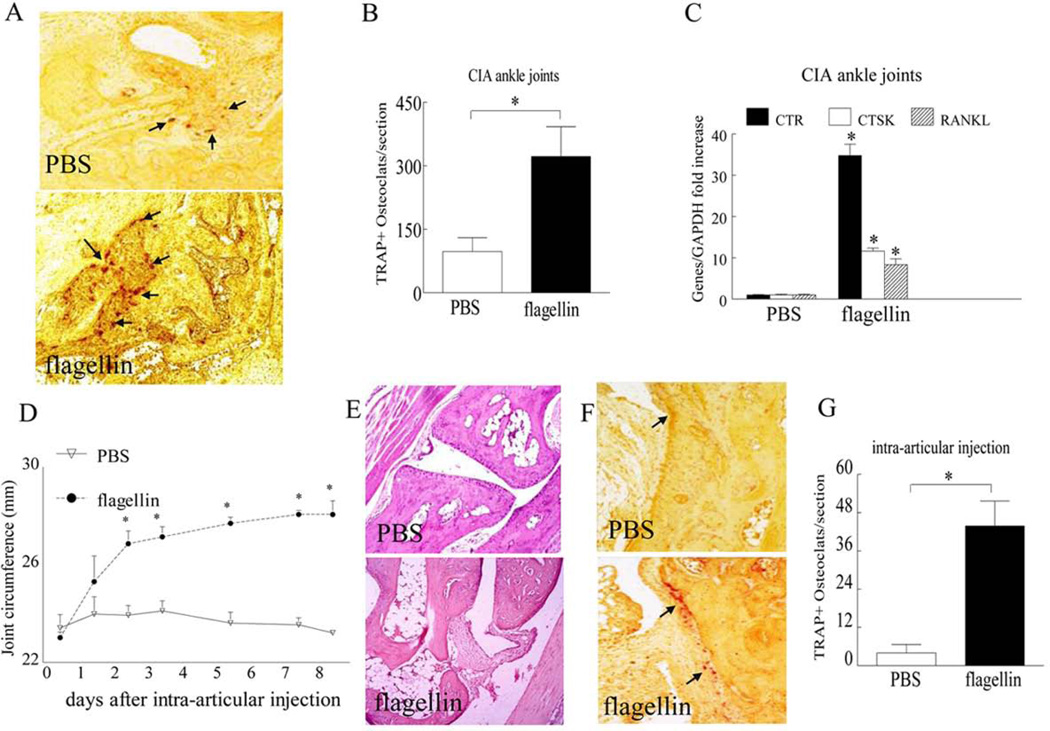
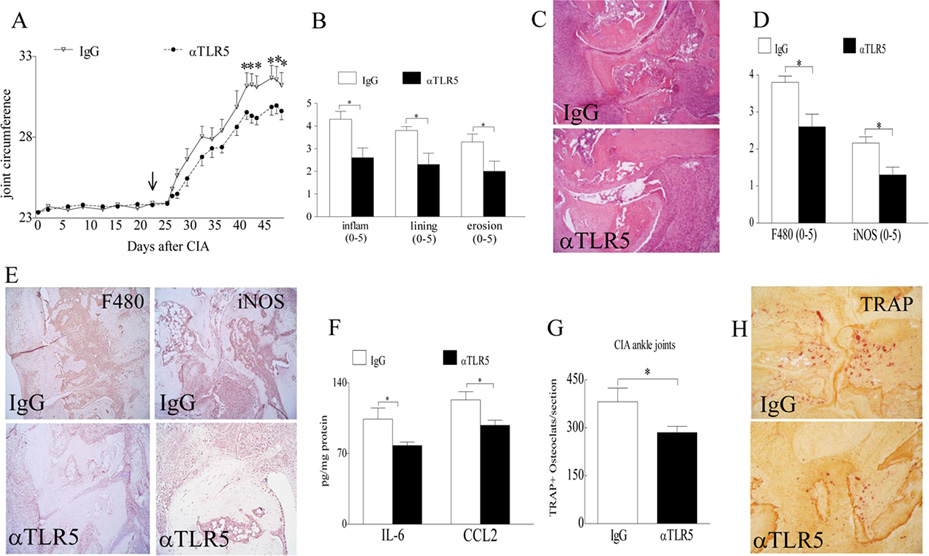
Our aim was to examine the impact of TLR5 ligation in rheumatoid arthritis (RA) and experimental arthritis pathology. Studies were conducted to investigate the role of TLR5 ligation on RA and mouse myeloid cell chemotaxis or osteoclast formation, and in addition, to uncover the significance of TNF-α function in TLR5-mediated pathogenesis. Next, the in vivo mechanism of action was determined in collagen-induced arthritis (CIA) and local joint TLR5 ligation models. Last, to evaluate the importance of TLR5 function in RA, we used anti-TLR5 Ab therapy in CIA mice. We show that TLR5 agonist, flagellin, can promote monocyte infiltration and osteoclast maturation directly through myeloid TLR5 ligation and indirectly via TNF-α production from RA and mouse cells. These two identified TLR5 functions are potentiated by TNF-α, because inhibition of both pathways can more strongly impair RA synovial fluid-driven monocyte migration and osteoclast differentiation compared with each factor alone. In preclinical studies, flagellin postonset treatment in CIA and local TLR5 ligation in vivo provoke homing and osteoclastic development of myeloid cells, which are associated with the TNF-α cascade. Conversely, CIA joint inflammation and bone erosion are alleviated when TLR5 function is blocked. We found that TLR5 and TNF-α pathways are interconnected, because TNF-α is produced by TLR5 ligation in RA myeloid cells, and anti-TNF-α therapy can markedly suppress TLR5 expression in RA monocytes. Our novel findings demonstrate that a direct and an indirect mechanism are involved in TLR5-driven RA inflammation and bone destruction.


Figures

Figure 1
Figure 1. TLR5 ligation promotes monocyte migration through activation of AKT1/PI3K, JNK and NF-κB pathways
A. Flagellin monocyte chemotaxis was performed in a Boyden chemotaxis chamber with varying concentration (0.001–100 ng/ml), n=3. B. Monocytes were incubated with anti-TLR5 antibody (10 µg/ml) or control IgG for 1h, thereafter chemotaxis was performed in response to 20% RA SF, n=8. C. Monocytes were stimulated with 100 ng/ml flagellin for 0–65 min, and the cell lysates were probed for pAKT1, pERK, p-p38, pJNK, pFAK, p-paxillin and degradation of IκB, n=3. D. Cells were pre-incubated with DMSO (D) or 1 and 5 µM inhibitors to PI3K (LY294002), ERK (PD98059), p38 (SB203580), JNK (SP600125) and NF-κB (Bay 11-7085) for 1h. Subsequently, monocyte chemotaxis was performed in response to 100 ng/ml of flagellin for 2h, n=3. For all experiments PBS and FMLP (f) served as negative and positive controls. Values demonstrate mean ± SE.* represents p <0.05.
Figure 2
Figure 2. TLR5 mediated monocyte trafficking is interconnected to TNF-α pathway and ligation of myeloid TLR5 is a strong promoter of RA osteoclast differentiation
A. Expression of TLR5 was quantified in RA monocytes treated with DMARDs (n=34) or with anti-TNF-α in the presence or absence of DMARDs (n=34). B. Monocyte migration was examined in response to various concentrations of flagellin (0.1 and 10 ng/ml) or TNF-α (0.1 and 5 ng/ml) alone or in combination. The combined doses were compared to the same doses treated alone, n=3. C. 20% RA SFs were incubated with 10 µg/ml IgG or anti-TNF-α and monocytes were either immunoneutralized by 10 µg/ml anti-TLR5 or IgG control prior to performing chemotaxis, n=7. D. RA PBMCs were differentiated to fully mature osteoclasts in the presence 20 ng/ml of M-CSF and RANKL, while suboptimal conditions consisted of 10 ng/ml M-CSF and RANKL, n=4. NL (n=3) (E) and RA PBMCs (n=4) (F) were exposed to varying concentrations of flagellin (0.001 to 100 ng/ml) in the presence of 10 ng/ml human M-CSF and RANKL (suboptimal condition) prior to TRAP staining and significance is compared to no flagellin treatment (0) in the suboptimal condition in E and F. G. Shows the representative TRAP staining (original magnification x 200) of F. Negative (-) and positive (+) controls consisted of untreated cells or cells treated with 20 ng/ml M-CSF and RANKL. Values demonstrate mean ± SE.* represents p <0.05.
Figure 3
Figure 3. Ligation of TLR5 in RA PBMCs drives the transcription of pro-osteoclastogenic factors and TLR5 ligation promotes RA myeloid cells to form mature osteoclasts in suboptimal culture conditions
Employing real-time RT-PCR, RANK (A), RANKL (B), TNF-α (C) and IFN-β (D) mRNA levels were quantified in RA osteoclast precursor cells that were cultured in suboptimal condition (10 ng/ml M-CSF and RANKL) for 7 days prior to being treated with PBS or 10 ng/ml flagellin for 6h in the absence of M-CSF and RANKL, n=7. Results are shown as fold increase above the PBS group and are normalized to GAPDH. E. NL and RA PBMC were immunostained with FITC labeled anti-CD3 antibody and PE-conjugated anti-TLR5 in order to determine the percentage of CD3+ and TLR5 positive cells, n=3 and F is a representative flow cytometry histogram of E. G. Negatively selected RA monocytes were cultured in the suboptimal condition and were either untreated (PBS) or treated with 10 ng/ml flagellin prior to TRAP staining. H. Shows the representative TRAP staining (original magnification x 200) of G. Negative and positive control consisted of untreated cells or cells treated with 20 ng/ml M-CSF and RANKL. Values demonstrate mean ± SE.* represents p <0.05.
Figure 4
Figure 4. In RA joint, TLR5 and TNF-α mediated osteoclastogenesis is interconnected
A. RA PBMCs cultured in suboptimal conditions (10 ng/ml M-CSF and RANKL) were untreated or pretreated with 10 µg/ml of IgG, anti-TNF-α and anti-TLR5 antibodies prior to being stimulated with 10 ng/ml flagellin, followed by TRAP staining. B. Is a representative image of TRAP+ cells (original magnification x 200) from A, n=3. C. RA PBMC were cultured in suboptimal condition and were either untreated or treated with 1ng/ml flagellin, 1ng/ml TNF-α or both prior to TRAP staining. D. Is a representative image of TRAP staining (original magnification x 200) from C, n=3. E. RA PBMCs cultured in suboptimal condition were immunoneutralized by 10 µg/ml IgG control or anti-TLR5 antibodies and cells were then incubated with 2% RA SF plus IgG or 2% RA SF plus anti-TNF-α (10 µg/ml) subsequent to TRAP staining, n=4. Negative and positive control consisted of untreated cells or cells treated with 20 ng/ml M-CSF and RANKL. Values demonstrate mean ± SEM, * represents p<0.05.
Figure 5
Figure 5. Flagellin strongly drives differentiation of murine PB monocytes and bone marrow cells to mature osteoclasts through TNF-α activation
A. Mouse PB monocytes were negatively selected and cultured in 10% α-MEM, 20 ng/ml of mouse M-CSF and RANKL. Mouse PB monocytes were either untreated (PBS) or treated with flagellin (10 ng/ml) for 14–21 days prior to TRAP staining. Mouse PB monocytes cultured in 10% α-MEM alone were considered as negative control and cells cultured in presence of 40 ng/ml M-CSF and RANKL served as the positive control. B. Is a representative image of TRAP+ cells (original magnification x 400) from A, n=3. C. Mouse bone marrow cells cultured for 4 days in 10% α-MEM, 10 ng/ml of mouse M-CSF plus 25 ng/ml mouse RANKL were untreated or stimulated with flagellin (10 ng/ml) plus IgG (10 µg/ml), flagellin (10 ng/ml) plus anti-TLR5 (10 µg/ml) or flagellin (10 ng/ml) plus anti-TNF-α (10 µg/ml) for 3 additional days before TRAP staining, n=3. Mouse bone marrow cells cultured in 10% α-MEM alone served as negative control and cells supplemented with mouse 10 ng/ml M-CSF and 100 ng/ml RANKL served as positive control. D. Is a representative image of TRAP+ cells (original magnification x 200) from C. E. Mouse TNF-α protein concentration was determined by ELISA in day 4 mouse bone marrow precursor cells cultured in 10% α-MEM, 10 ng/ml of mouse M-CSF plus 25 ng/ml mouse RANKL either untreated (PBS) or treated with flagellin (100 ng/ml) plus IgG (10 µg/ml) versus flagellin (100 ng/ml) plus anti-TLR5 (10 µg/ml) for 24 h, n=5. F. TNF-α and IFN-β real time RT-PCR was performed on mouse bone marrow cells from day 4 cultured in 10% α-MEM, 10 ng/ml of mouse M-CSF plus 25 ng/ml mouse RANKL and treated with or without flagellin (100 ng/ml) for 6, 24, 48 and 72h, n=3. Values demonstrate mean ± SEM, * represents p<0.05.
Figure 6
Figure 6. Flagellin post onset treatment in CIA contributes to joint inflammation, elevated joint myeloid cell trafficking and TNF-α production
A. Changes in joint circumference was determined in CIA mice that were treated i.p. with PBS or flagellin (20 µg) on day 33, n= 10. B. Ankles were harvested on day 57 from CIA mice treated with PBS or flagellin and were H&E stained (original magnification x 200), n=7. C. STs from CIA mice treated with PBS or flagellin were harvested on day 57 and were immunostained with anti-F480 antibody (original magnification x 200), arrows demonstrate F480+ cells. D. Macrophage staining was quantified on a 0–5 scale, n=7. E. TNF-α protein levels (pg/ml) were quantified by ELISA in ankle homogenates from CIA mice treated with PBS or flagellin, n=7. F. Transcription of IFN-β was determined by real-time RT-PCR in CIA ankles which had received post onset treatment of flagellin or control and the data are shown as fold increase above PBS group and are normalized to GAPDH, n=5.Values are mean ± SE. * indicates p<0.05.
Figure 7
Figure 7. TLR5 ligation facilitates osteoclast formation in vivo in RA animal models
A. Ankles harvested from CIA mice treated with PBS or flagellin were TRAP stained (TRAP+ cells are shown by arrows) and (B) the number of TRAP+ cells were counted per section, n=7. C. Transcription of calcitonin receptor (CTR), Cathepsin K (CTSK) and RANKL was determined by real-time RT-PCR in CIA ankles which had received post onset treatment of flagellin or control and the data are shown as fold increase above PBS group and are normalized to GAPDH, n=5. D. Changes in joint circumference in mice i.a. injected with PBS or 20µg of flagellin; n=5. Ankles harvested from local injection of PBS or flagellin on day 10 were H&E (E) and TRAP (F) stained (TRAP+ cells are shown by arrows) and (G) number of TRAP+ cells were counted per section, n=5. Values are mean ± SE. * indicates p<0.05.
Figure 8
Figure 8. Anti-TLR5 antibody treatment alleviates CIA joint swelling and bone resorption
A. Changes in joint circumference were recorded for CIA mice that were treated i.p. with IgG or anti-TLR5 Ab (100 µg/mouse) on days 23, 27, 30, 34, 37, 41, 44 and 48 and mice were sacrificed on day 49 post induction, n=6 mice (12 ankles). B. Effect of anti-TLR5 Ab treatment on inflammation, lining thickness, and bone erosion was scored on a 0–5 scale, n=6. C. Is the representative ankle H&E staining (original magnification × 200) of Fig. B. D. Synovial tissues from CIA mice treated with IgG or anti-TLR5 antibody were harvested on day 49 and immunostained with anti-F480 (1:100 dilution) or iNOS Abs (1:200 dilution) (original magnification × 200). Joint myeloid cells and iNOS+ M1 macrophages staining were quantified on a 0–5 scale, n=6. E. Is the representative F480 and iNOS immunostaining (original magnification × 200) of Fig. D. F. Changes in IL-6 and CCL2 protein levels in ankle homogenates from CIA mice treated with IgG control or anti-TLR5 antibody were determined by ELISA, n=6. G. Number of TRAP+ cells were counted per section in CIA mice treated with IgG or anti-TLR5 Ab, n=6. H. Is the representative ankle TRAP staining (original magnification × 200) of Fig. G. Values are mean ± SE. *p < 0.05.

Comment in

References

    1. Brentano F, Kyburz D, Schorr O, Gay R, Gay S. The role of Toll-like receptor signalling in the pathogenesis of arthritis. Cell Immunol. 2005;233:90–96. - PubMed
    1. Drexler SK, Sacre SM, Foxwell BM. Toll-like receptors: a new target in rheumatoid arthritis? Expert Rev Clin Immunol. 2006;2:585–599. - PubMed
    1. Fujikawa Y, Sabokbar A, Neale S, Athanasou NA. Human osteoclast formation and bone resorption by monocytes and synovial macrophages in rheumatoid arthritis. Ann Rheum Dis. 1996;55:816–822. - PMC - PubMed
    1. Schett G. Joint remodelling in inflammatory disease. Ann Rheum Dis. 2007;3(66 Suppl):ii42–ii44. - PMC - PubMed
    1. Braun T, Zwerina J. Positive regulators of osteoclastogenesis and bone resorption in rheumatoid arthritis. Arthritis Res Ther. 2011;13:235. - PMC - PubMed

Publication types

MeSH terms