

Review
doi: 10.1007/978-1-4939-1221-6_1.
Evolutionary conservation and expression of human RNA-binding proteins and their role in human genetic disease
Affiliations
- PMID: 25201102
- PMCID: PMC4180674
- DOI: 10.1007/978-1-4939-1221-6_1
Item in Clipboard
Review
Evolutionary conservation and expression of human RNA-binding proteins and their role in human genetic disease
Adv Exp Med Biol.
2014.
Abstract
RNA-binding proteins (RBPs) are effectors and regulators of posttranscriptional gene regulation (PTGR). RBPs regulate stability, maturation, and turnover of all RNAs, often binding thousands of targets at many sites. The importance of RBPs is underscored by their dysregulation or mutations causing a variety of developmental and neurological diseases. This chapter globally discusses human RBPs and provides a brief introduction to their identification and RNA targets. We review RBPs based on common structural RNA-binding domains, study their evolutionary conservation and expression, and summarize disease associations of different RBP classes.
Figures
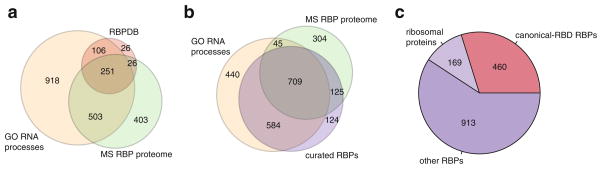
Different approaches to define the catalogue of human RBPs. (a) Venn diagram showing the overlap of proteins with RNA-related Gene Ontology (GO) categories (Ashburner et al. 2000) (orange), the human RNA-binding proteome identified by RNA-cross-linking and mass spectrometry studies (MS RBP proteome, green) (Baltz et al. 2012; Castello et al. 2012; Kwon et al. 2013), and the RBPDB database of human RBPs with canonical RBDs (Cook et al. 2011) (red). (b) Venn diagram showing the overlaps of GO RBPs (orange), MS RBP proteome (green), and the curated RBP list based on analysis of RNA-binding domains and experimental evidence of RNA binding found in the literature (violet). (c) Composition of RBPs in the curated RBP list: Canonical-RBD RBPs (containing canonical RBDs (Lunde et al. 2007; Cook et al. 2011), red), ribosomal proteins (bright violet), other RBPs (dark violet)
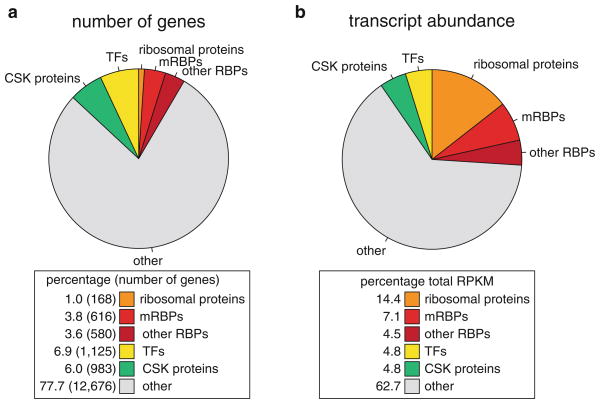
Analysis of RBP abundance. Curated RBPs are subclassified into ribosomal proteins (orange), mRBPs (bright red), and other RBPs (dark red). Percentages of RBPs are compared to a set of GO-defined transcription factors (TFs, yellow), a set of GO-defined cytoskeletal proteins (CSK proteins, green) (Ashburner et al. 2000), and all other expressed genes (grey). (a) Count of expressed genes with RPKM > 1 in RNA-seq data from HEK293 cells (Teplova et al. 2013). (b) Relative abundance of each gene group is given by the summation of expression levels of genes in each category
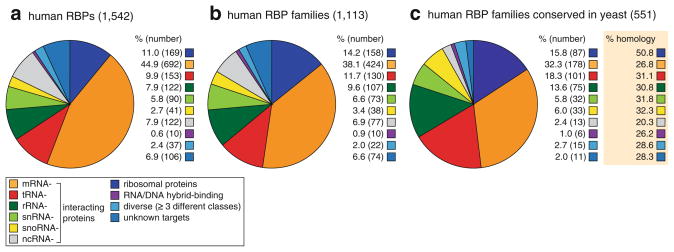
Number of RBPs involved in different RNA pathways. Curated RBPs are categorized into the following groups: (1) Ribosomal proteins and RBP-interacting proteins (e.g., TUDOR proteins, RBP transport proteins) (dark blue), (2) mRNA-binding proteins (orange), tRNA-binding proteins (red), rRNA-binding proteins (dark green), snRNA-binding proteins (bright green), snoRNA-binding proteins (yellow), ncRNA-binding proteins (ncRNAs defined as miRNA, piRNA, MRP, 7SL, XIST, lincRNAs, telRNA, etc.) (light grey), RNA/DNA-hybrid-interacting proteins (violet), RBPs interacting unselectively with a range of RNA targets (light blue), RBPs with unknown RNA targets (marine blue). Distribution into the listed categories of the (a) 1,542 curated human RBPs, (b) 1,113 human paralogous RBP families, and (c) conserved paralogous RBP families in S. cerevisiae and their average conservation score (orange box)
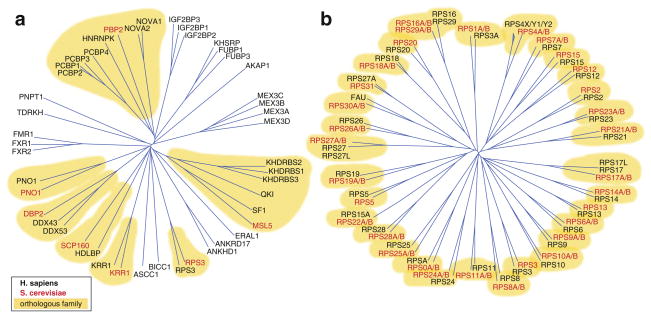
Phylogenetic trees of (a) KH-containing proteins and (b) ribosomal proteins of the small subunit. Branch lengths are scaled to the sequence identity of the proteins. S. cerevisiae proteins are marked in red, human proteins in black, homologous families with conserved members in S. cerevisiae highlighted in yellow
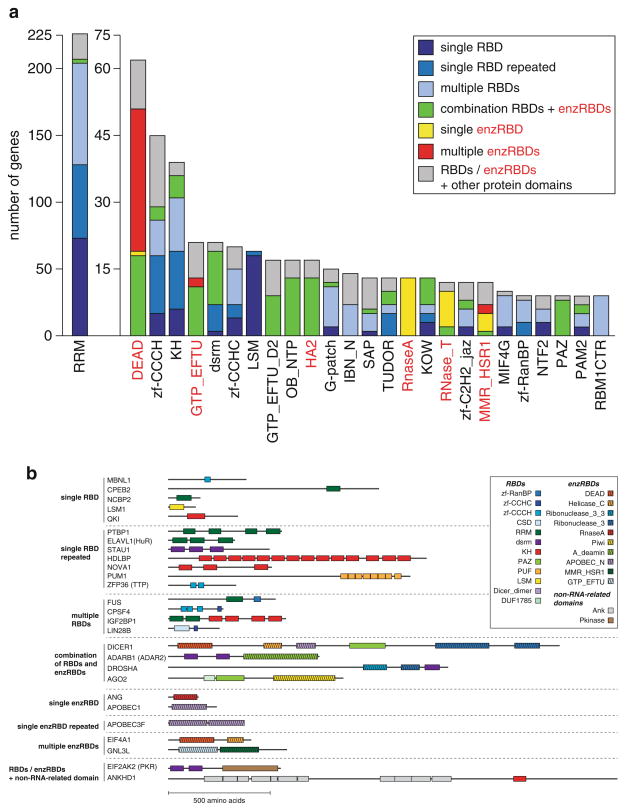
(a) Analysis of structural patterns of the most abundant RNA-binding domains (with ≥ 9 members) in humans. Shown are the counts for the number of genes containing the listed RNA-binding domains (with ≥ 9 members) named by its Pfam abbreviation (Finn et al. 2010). RNA-binding domains are categorized into those binding RNA without additional enzymatic activity (RBD) (black) and those with additional enzymatic activity (enzRBD) (red). The RBD category was broadly defined to include protein-protein interacting domains known to interact with RBPs, such as those found in TUDOR family proteins (TUDOR) or ribosomal proteins. The following structural patterns are counted: (1) singular occurrence of an RNA-binding domain (RBD—dark blue, enzRBD—yellow), (2) single RBD repeated (RBD—marine blue), (3) multiple RBDs (RBD—light blue, enzRBD—red), (4) combinations of RBDs and enzRBDs (green), and (5) combination of at least one RBD/enzRBD with at least one other, non-RNA-related protein domain (grey). (b) Scheme of domain structure organization of representative RBPs, categorized into the domain combination classes listed in (a)
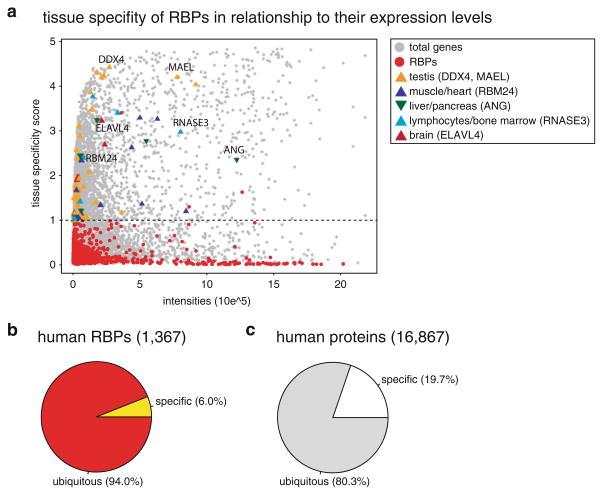
Tissue specificity of RBPs based on their mRNA expression profiles in a human microar-ray tissue atlas (Dezso et al. 2008). (a) Plot of maximum expression intensity versus their tissue specificity score. The threshold for tissue specificity is set at 1 (dashed line), to include the brain- specific ELAVL and NOVA splicing factor families and the germline-specific PIWI family. Protein-coding genes are marked as grey-filled circles and RBPs as red-filled circles. Tissue-specific RBPs are marked based on the tissue with their highest expression: testis (orange triangle), muscle/heart (dark blue triangle), liver/pancreas (dark green inverted triangle), lymphocytes/bone marrow (light blue triangle), brain (dark red triangle). In (b) the number of tissue-specific RBPs is compared to all expressed RBPs and in (c) the number of tissue-specific proteins is compared to total expressed proteins
References
Publication types
MeSH terms
Substances
Grants and funding
LinkOut - more resources
Full Text Sources
Other Literature Sources
Medical
