. 2014 Sep 25;159(1):163-175.
doi: 10.1016/j.cell.2014.08.017. Epub 2014 Sep 4.

Identification of multipotent luminal progenitor cells in human prostate organoid cultures

Affiliations

Identification of multipotent luminal progenitor cells in human prostate organoid cultures

Wouter R Karthaus et al. Cell. .

Abstract

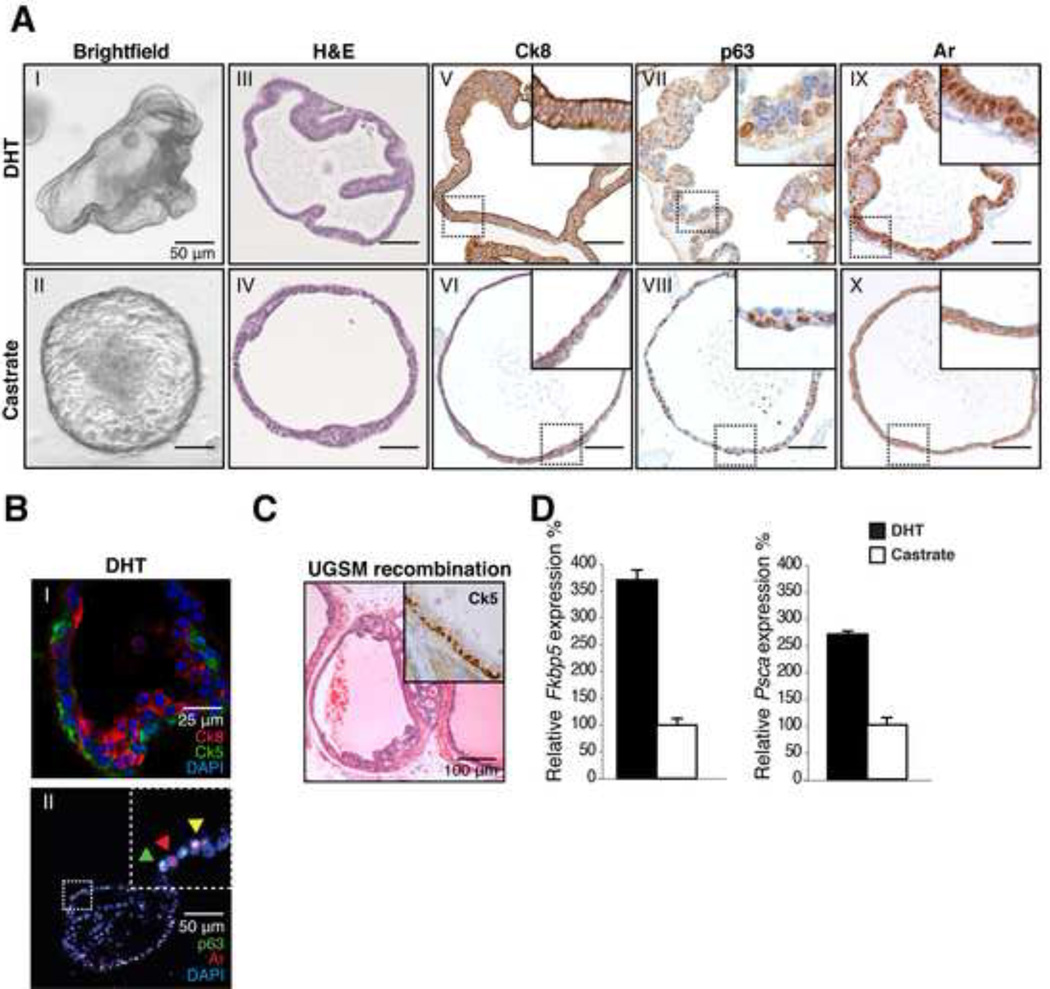
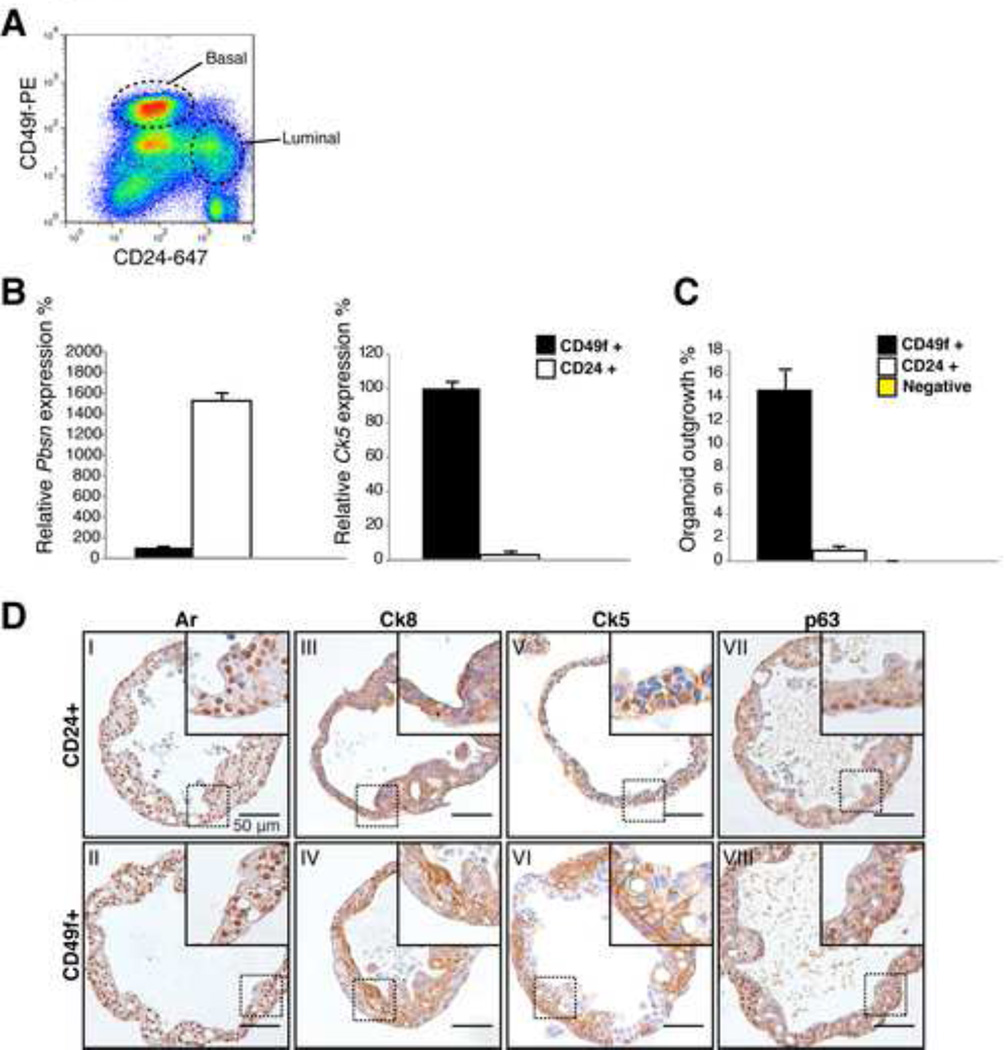
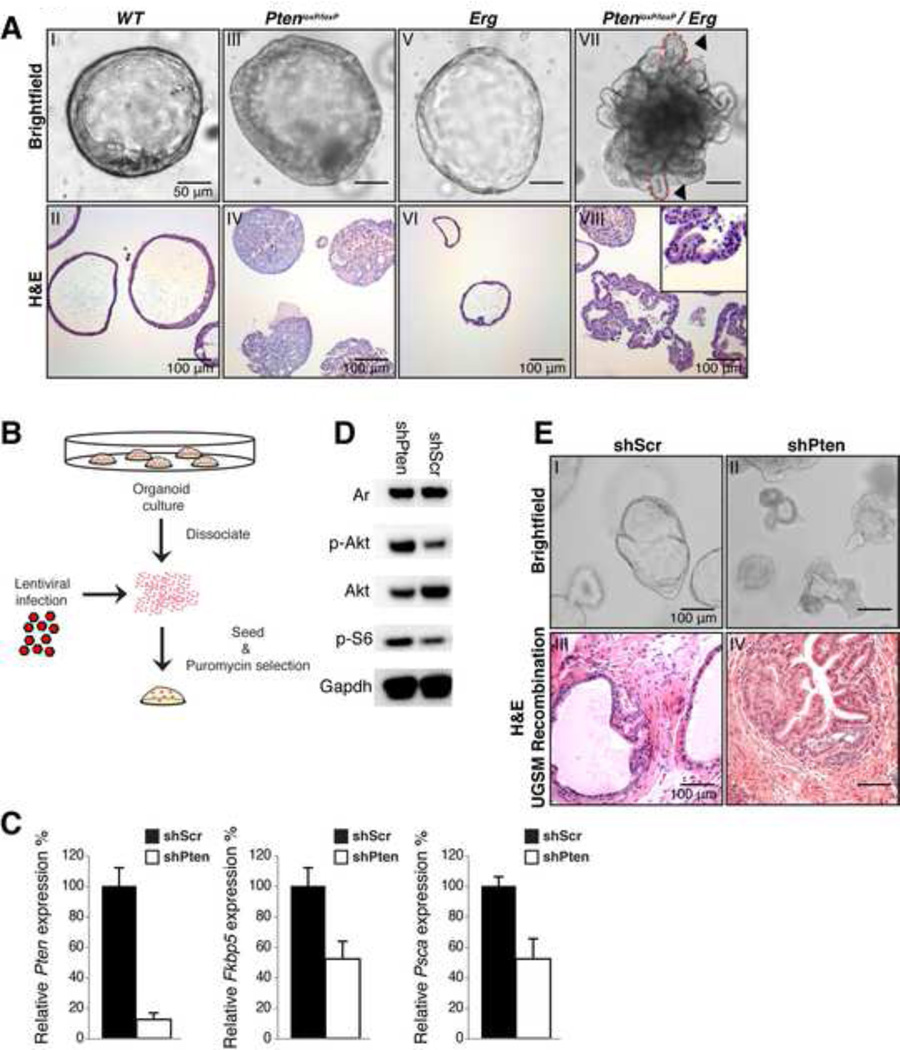
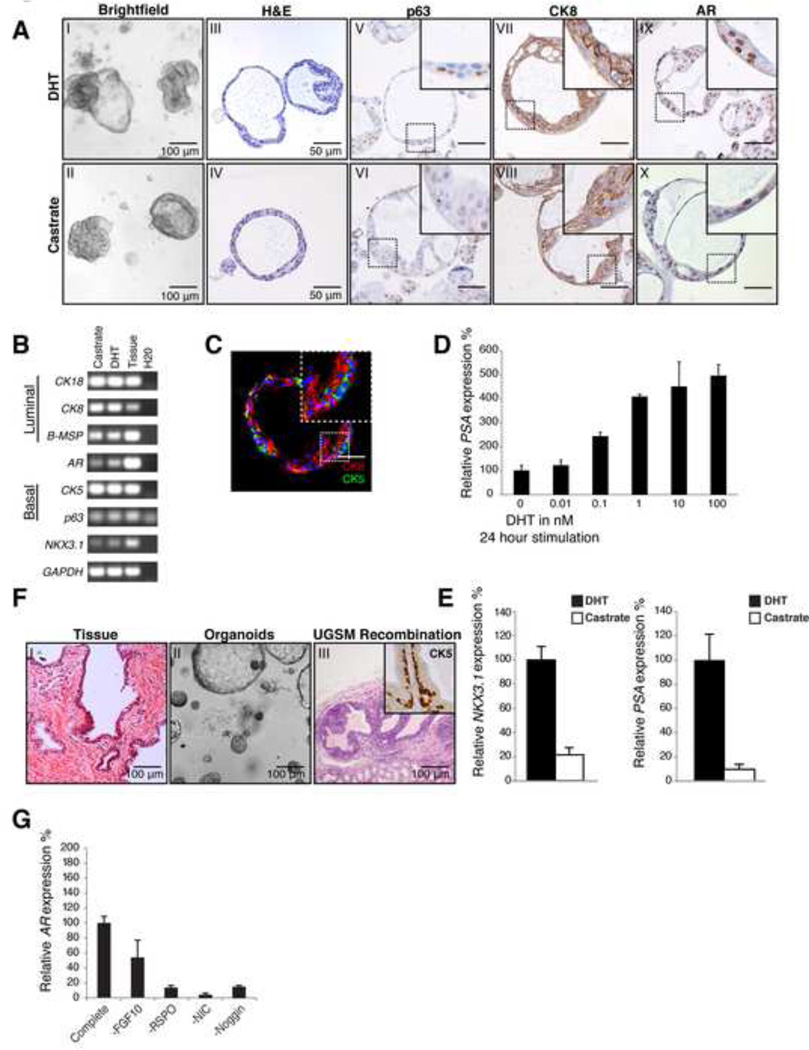
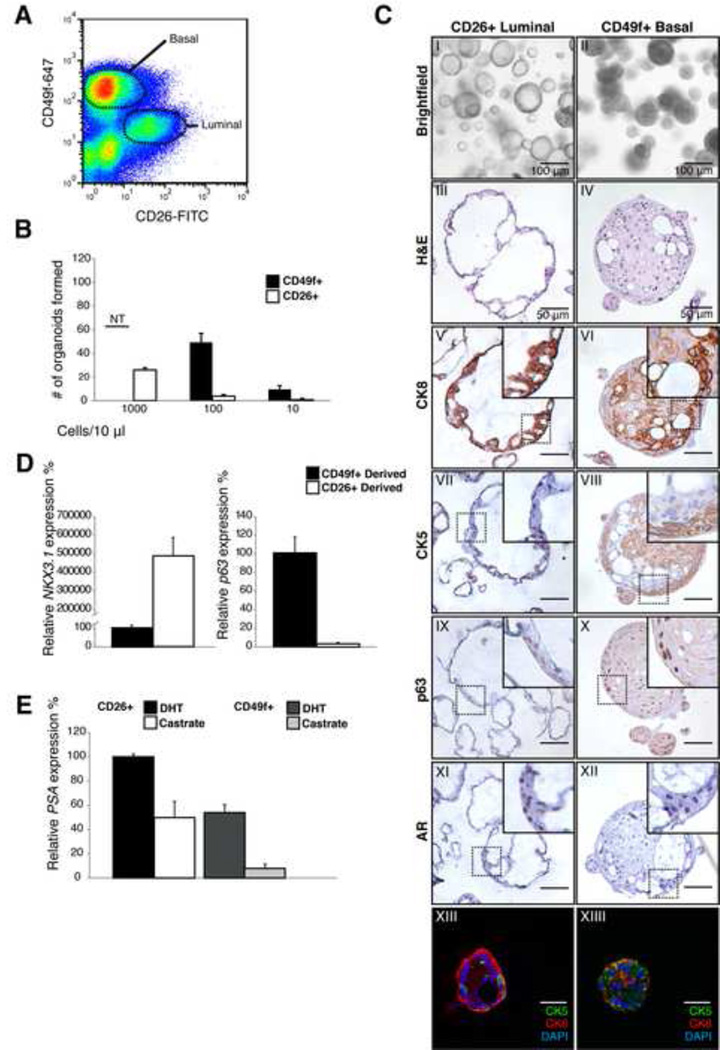
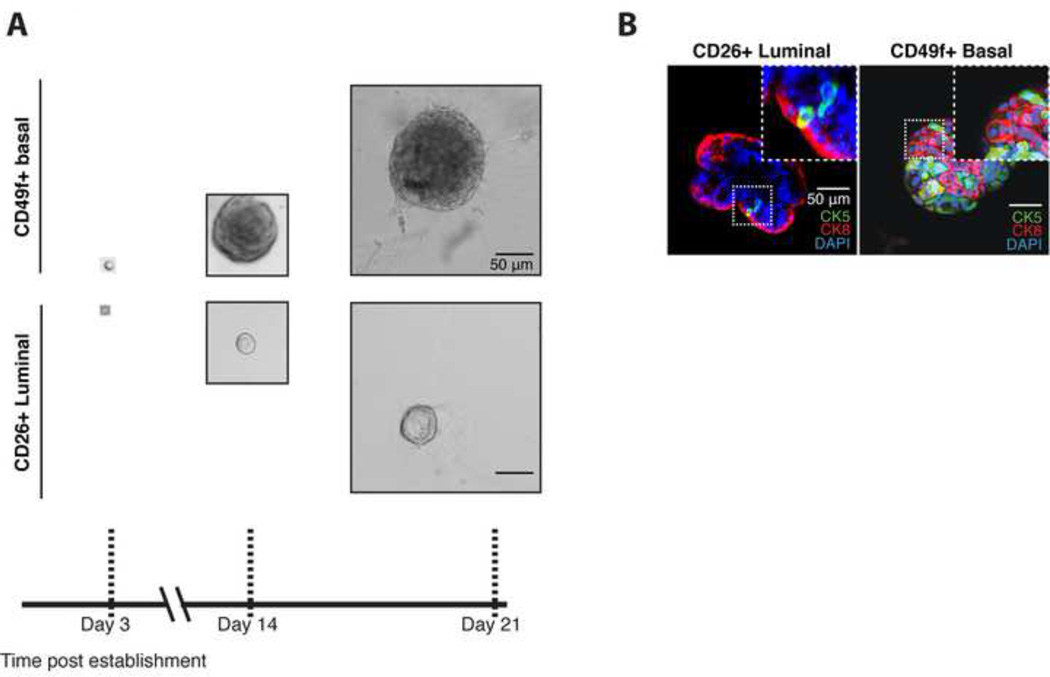
The prostate gland consists of basal and luminal cells arranged as pseudostratified epithelium. In tissue recombination models, only basal cells reconstitute a complete prostate gland, yet murine lineage-tracing experiments show that luminal cells generate basal cells. It has remained challenging to address the molecular details of these transitions and whether they apply to humans, due to the lack of culture conditions that recapitulate prostate gland architecture. Here, we describe a 3D culture system that supports long-term expansion of primary mouse and human prostate organoids, composed of fully differentiated CK5+ basal and CK8+ luminal cells. Organoids are genetically stable, reconstitute prostate glands in recombination assays, and can be experimentally manipulated. Single human luminal and basal cells give rise to organoids, yet luminal-cell-derived organoids more closely resemble prostate glands. These data support a luminal multilineage progenitor cell model for prostate tissue and establish a robust, scalable system for mechanistic studies.


Conflict of interest statement

Author Contributions

The other authors declare no conflict of interest

Figures

Figure 1
Figure 1. Establishment of murine prostate cultures
A: IHC analysis of murine organoids in the presence of DHT (1 nM) and in castrate conditions. Brightfield image (I-II) H&E staining (III-IV) Ck8 (V-VI) p63 (VII-VIII) Ar (IX-X). Strong increase in cell size is observed upon DHT addition as well as nuclear localization of the Ar. Scale bars represent 50 microns. B: IF staining (I) of basal Ck5 (Green) and luminal Ck8 (Red) in organoids. Distinct luminal and basal cell populations are present in organoids. Bottom (II) staining for p63 (green) and Ar (Red) showing single positive (Green & Red arrowhead) and double positive Ar/p63 cells (Yellow arrowhead). C: H&E stain of UGSM recombination 8 weeks after transplantation of 50,000 organoid cells derived from wildtype mice. Inset; Ck5 staining, confirming presence of basal cells. D: Quantitative RT-PCR of Ar targets Psca and Fkbp5 in the presence of DHT (1 nM) and in castrate conditions (24 hours). Psca and Fkbp5 transcripts are increased upon DHT addition. Expression was normalized to Hprt. Results are shown as mean ± SD. See also Figure S1
Figure 2
Figure 2. Basal and luminal cells give rise to organoids
A: FACS plot of CD24 (luminal) CD49f (basal) stained murine prostate. B: Quantitative RT-PCR expression analysis of basal (Ck5) and luminal (Probasin, Pbsn) marker expression in CD24+ luminal and CD49f+ basal cells. Pbsn is strongly expressed in luminal cells, Ck5 is strongly expressed in basal cells. Expression was normalized to Hprt. Results are shown as mean ± SD. C: Percentage of organoids established by 200 single cells 14 days post seeding. Approximately 15% of basal cells generate an organoid. 1% of luminal cells generate an organoid. Results are shown as mean ± SD. D: IHC stainings of single cell derived murine prostate organoids, showing similar staining patterns of Ar (I-II), Ck8 (III-IV), Ck5 (V-VI) and p63 (VII-VIII) and morphology, showing that basal cells and luminal cells are both capable of giving rise to both epithelial lineages. Scale bars represent 50 microns. See also Figure S2
Figure 3
Figure 3. Genetically engineered mouse prostate cancer models are recapitulated in organoids
A: Brightfield and H&E images of wildtype (WT) (I-II) PBCre PtenloxP/loxP (III-IV) PBCre Rosa LSL-ERG (V-VI) and PBCre PtenloxP/loxP Rosa LSL-ERG (VII-VIII). In Pten loxP/loxP organoids the lumen is filled with hyperplastic cells. PtenloxP/loxP /ERG organoids make fingerlike protrusions are made into the Matrigel (Arrowheads, dashed lines, inset VIII). B: Schematic overview of retroviral infection. C: Quantitative RT-PCR analysis of Pten, Fkbp5 and Psca expression in shPten and shScr-control infected PBCre Rosa26 LSL-ERG organoids. Upon Pten knockdown Ar target gene expression is diminished. Expression was normalized to Hprt. Results are shown as mean ± SD. D: Western blot analysis of PI3K pathway activation in shPten and ShScr-control infected PBCre Rosa26 LSL-ERG organoids. p-Akt and p-S6 levels are increased upon Pten knockdown. E: Brightfield image of shPten-RFP shScr–RFP infected PBCre Rosa26 LSL-ERG organoids (I-II) and corresponding H&E staining of shPten/shScr organoid-UGSM recombinations (III & IV) showing hyperplastic phenotype in organoids and in UGSM recombinations upon Pten knock down. Scale bars in A, B and E represent 50 microns. See also Figure S3
Figure 4
Figure 4. Establishment of human prostate organoid cultures
A: IHC analysis of passage 6 (12 week) human organoids in the presence of DHT (1 nM) and in castrate conditions. Brightfield image (I-II) H&E staining (III-IV) p63 (V-VI) CK8 (VII-VIII) AR (IX-X). Upon DHT addition nuclear localization of the AR is observed. Scale bars represent 50 microns. B: RT-PCR analysis of prostate organoids show that both luminal and basal markers are expressed in the absence and presence of DHT (1 nM). C: IF staining of basal CK5 (Green) and luminal CK8 (Red) in organoids. Distinct luminal and basal cell populations are present in organoids. D: Quantitative RT-PCR Analysis of PSA 24 hours after DHT stimulation (0 nM – 100 nM). Expression was normalized to GAPDH. Results are shown as mean ± SD (n=3) E: Quantitative RT-PCR analysis of AR targets NKX3.1 and PSA in the presence of DHT (1 nM) and without DHT (castrate) (24 hours). Upon DHT addition a strong increase of PSA and NKX3.1 transcript is observed. Expression was normalized to GAPDH. Results are shown as mean ± SD (n=3). F: H&E stain of UGSM recombination 8 weeks after transplantation of 50,000 human organoid cells derived. Inset; CK5 staining, confirming presence of basal cells. Scale bars represent 50 microns. G: Quantitative RT-PCR of AR mRNA levels in the absence of growth factors. Withdrawal of Noggin, R-spondin, FGF10 and Nicotinamide led to reduced AR expression. Expression was normalized to GAPDH. Results are shown as mean ± SD. See also Figure S4
Figure 5
Figure 5. Establishment of human prostate organoid cultures from luminal and basal cells
A: FACS plot of human prostate cells stained with CD26 (luminal) and CD49f (basal) markers B: Organoid outgrowth from CD49f+ basal and CD26+ luminal cells at varying densities. Results are shown as mean ± SD. *NT, Non Testable. At higher densities CD49f-derived organoids fuse, making counting of organoid number therefore unreliable. C: Analysis of CD26-derived (luminal) and CD49f-derived (basal) organoids at passage 4. Brightfield picture (I-II) H&E staining (III-IV) CK8 (V-VI) CK5 (VII-VIII) p63 (IX-X) AR (XI-XII) IF stain of CK5 (green) and CK8 (red) showing distinct basal and luminal cells (XIII-XIV). Scale bars represent 50 microns. D: Quantitative RT-PCR expression analysis of the luminal marker NKX3.1 and basal marker p63 in luminal and basal organoids at passage 4. Expression was normalized to GAPDH. Results are shown as mean ± SD. E: Quantitative RT-PCR of the AR target PSA in the presence of DHT (1 nM) and in castrate conditions (24 hours). Increased PSA mRNA levels are observed in both luminal- and basal-derived organoids after DHT treatment. Expression was normalized to GAPDH. Results are shown as mean ± SD. See also Figure S5
Figure 6
Figure 6. Single human basal and luminal cells give rise to organoids
A: Brightfield images of organoids grown from single CD26+ luminal and CD49f+ basal cells. B: IF stain of CK5 (Green) and CK8 (Red) showing distinct basal and luminal cells in single luminal cell- and single basal cell-derived organoids (Passage 4). Scale bars represent 50 microns.

Comment in

References

    1. Barbieri C, Baca S, Lawrence M, Demichelis F, Blattner M, Theurillat J-P, White T, Stojanov P, Van Allen E, Stransky N, et al. Exome sequencing identifies recurrent SPOP, FOXA1 and MED12 mutations in prostate cancer. Nature genetics. 2012;44:685–689. - PMC - PubMed
    1. Barker N, Huch M, Kujala P, van de Wetering M, Snippert H, van Es J, Sato T, Stange D, Begthel H, van den Born M, et al. Lgr5(+ve) stem cells drive self-renewal in the stomach and build long-lived gastric units in vitro. Cell stem cell. 2010;6:25–36. - PubMed
    1. Bhatia-Gaur R, Donjacour A, Sciavolino P, Kim M, Desai N, Young P, Norton C, Gridley T, Cardiff R, Cunha G, et al. Roles for Nkx3.1 in prostate development and cancer. Genes & development. 1999;13:966–977. - PMC - PubMed
    1. Binnerts M, Kim K-A, Bright J, Patel S, Tran K, Zhou M, Leung J, Liu Y, Lomas W, Dixon M, et al. R-Spondin1 regulates Wnt signaling by inhibiting internalization of LRP6. Proceedings of the National Academy of Sciences of the United States of America. 2007;104:14700–14705. - PMC - PubMed
    1. Carmon K, Gong X, Lin Q, Thomas A, Liu Q. R-spondins function as ligands of the orphan receptors LGR4 and LGR5 to regulate Wnt/beta-catenin signaling. Proceedings of the National Academy of Sciences of the United States of America. 2011;108:11452–11457. - PMC - PubMed

Publication types