

Cancer incidence rates and trends among children and adolescents in the United States, 2001-2009
- PMID: 25201796
- PMCID: PMC4536809
- DOI: 10.1542/peds.2013-3926
Cancer incidence rates and trends among children and adolescents in the United States, 2001-2009
Abstract
Objectives: Cancer continues to be the leading disease-related cause of death among children and adolescents in the United States. More current information is needed to describe recent cancer trends and identify demographic and geographic variations.
Methods: We analyzed data from the National Program of Cancer Registries and Surveillance, Epidemiology, and End Results statewide registries representing 94.2% of the US population to identify cancers diagnosed among persons aged 0 to 19 years during 2001-2009. Age-adjusted rates and annual percentage change for trends were calculated. Data were stratified by age, gender, race, ethnicity, and geography.
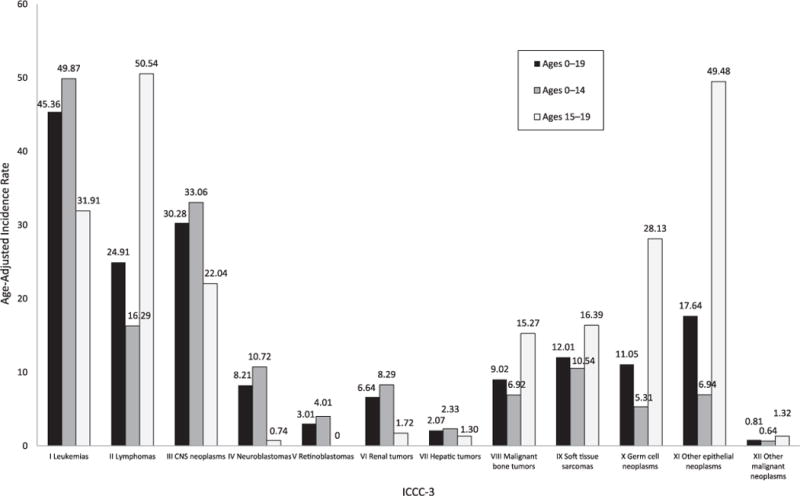
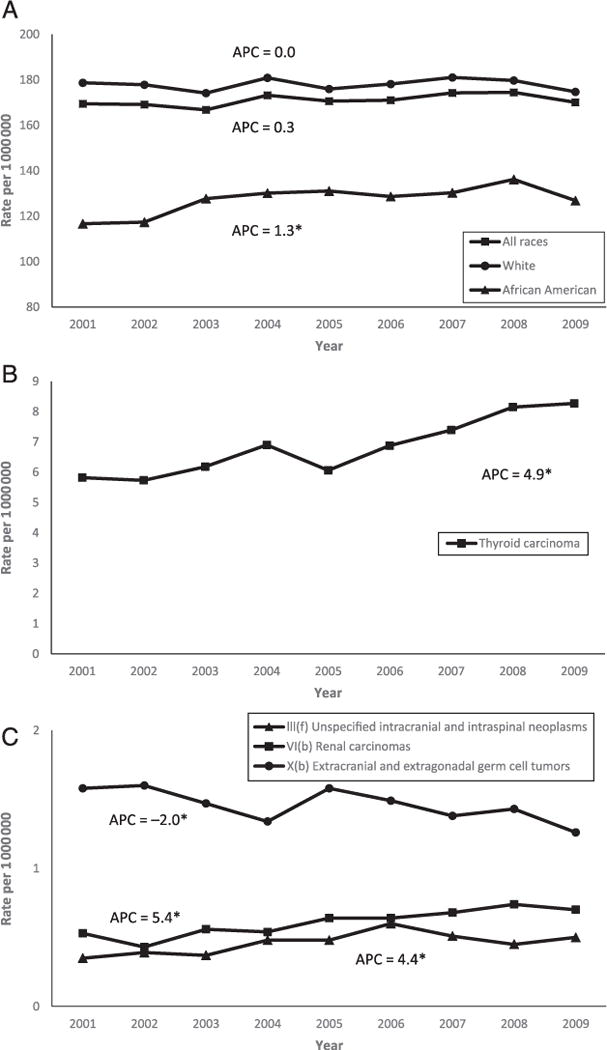
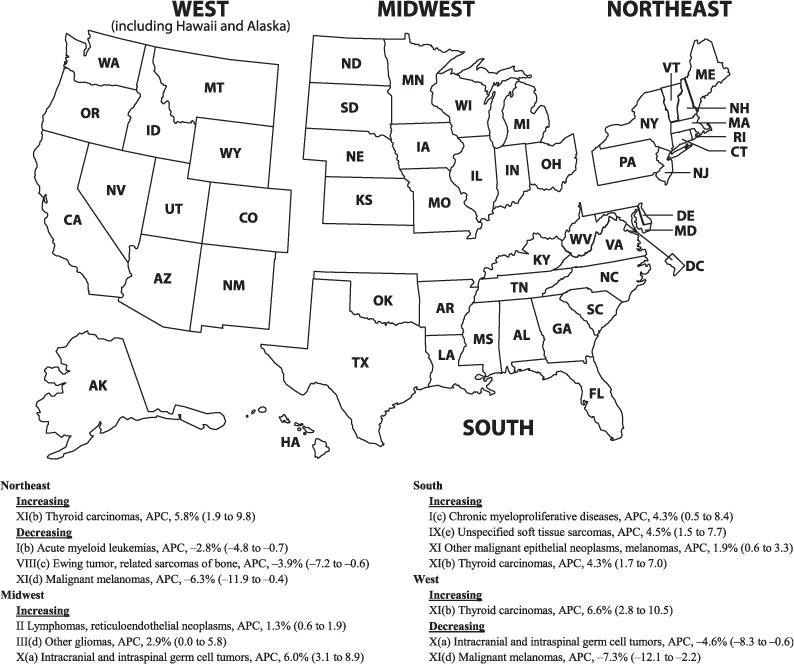
Results: We identified 120,137 childhood and adolescent cancer cases during 2001-2009 with an age-adjusted incidence rate of 171.01 per million. The overall rate of all cancers combined remained stable over time (annual percent change [APC], 0.3%; 95% confidence interval [CI], -0.1 to 0.7). There was an increase in the overall cancer trend among African American children and adolescents (APC, 1.3%; 95% CI, 0.2 to 2.5). An increasing trend for thyroid cancer was observed among both genders (APC, 4.9%; 95% CI, 3.2 to 6.6) and specifically among adolescents and those in the Northeast, South, and West regions of the United States. Renal carcinoma incidence was increasing significantly overall (APC, 5.4%; 95% CI, 2.8 to 8.1). Extracranial and extragonadal germ cell tumors and melanoma were both significantly decreasing.
Conclusions: This study reports the novel finding that renal carcinoma rates are increasing among children and adolescents. This study confirms that thyroid cancer rates are increasing and further describes rising cancer rates among African Americans.
Keywords: adolescent; cancer; children; incidence; pediatric.
Copyright © 2014 by the American Academy of Pediatrics.
Figures
References
-
- Heron M, Sutton PD, Xu J, Ventura SJ, Strobino DM, Guyer B. Annual summary of vital statistics: 2007. Pediatrics. 2010;125(1):4–15. - PubMed
-
- National Vital Statistics System, Centers of Disease Control and Prevention. 10 leading causes of death by age group, United States – 2008. Available at: www.cdc.gov/injury/wisqars/leadingcauses.html. Accessed February 9, 2012.
-
- Li J, Thompson TD, Miller JW, Pollack LA, Stewart SL. Cancer incidence among children and adolescents in the United States, 2001–2003. Pediatrics. 2008;121(6) Available at: www.pediatrics.org/cgi/content/full/121/6/e1470. - PubMed
-
- Linabery AM, Ross JA. Trends in childhood cancer incidence in the U.S. (1992–2004) Cancer. 2008;112(2):416–432. - PubMed
MeSH terms
Grants and funding
LinkOut - more resources
Full Text Sources
Other Literature Sources
