. 2014 Sep 8:3:e04395.
doi: 10.7554/eLife.04395.

Mapping the zoonotic niche of Ebola virus disease in Africa

Affiliations

Mapping the zoonotic niche of Ebola virus disease in Africa

David M Pigott et al. Elife. .

Abstract

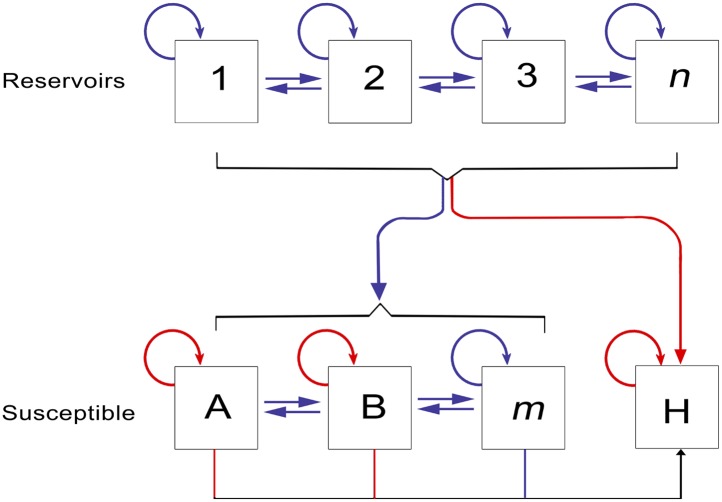
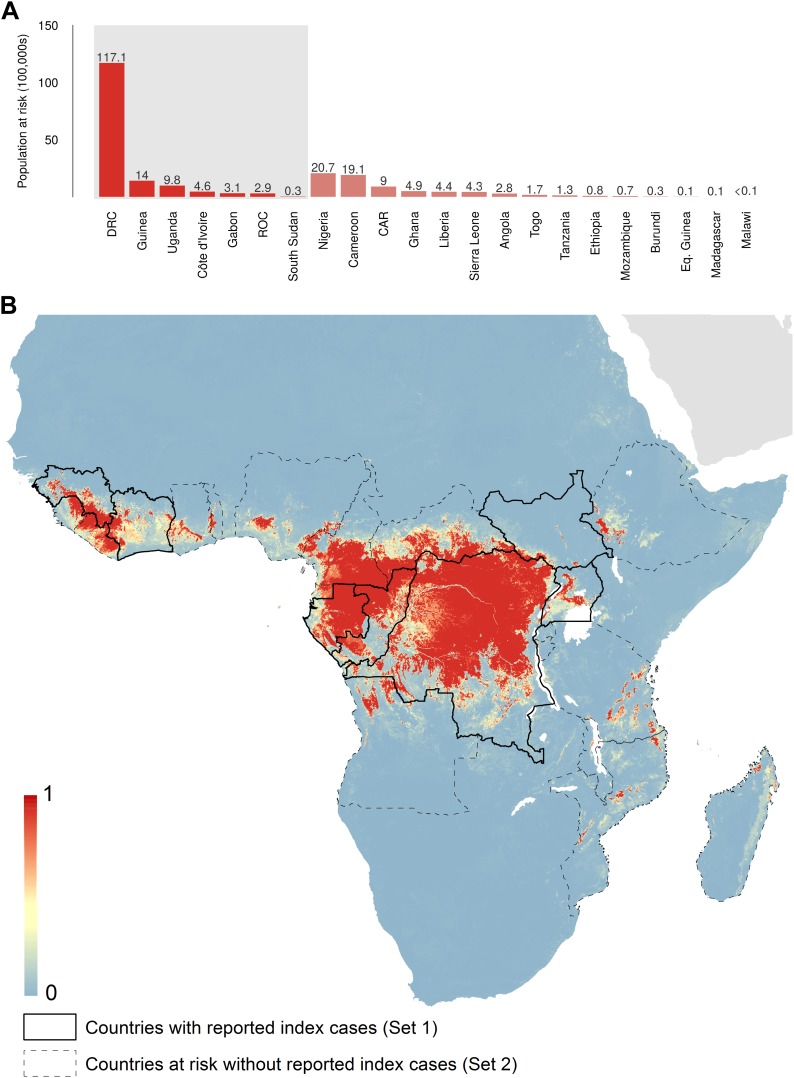
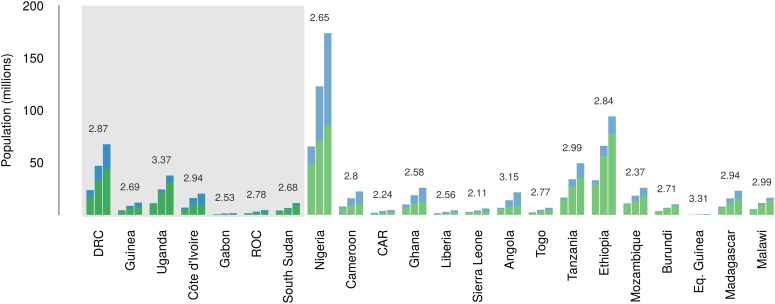
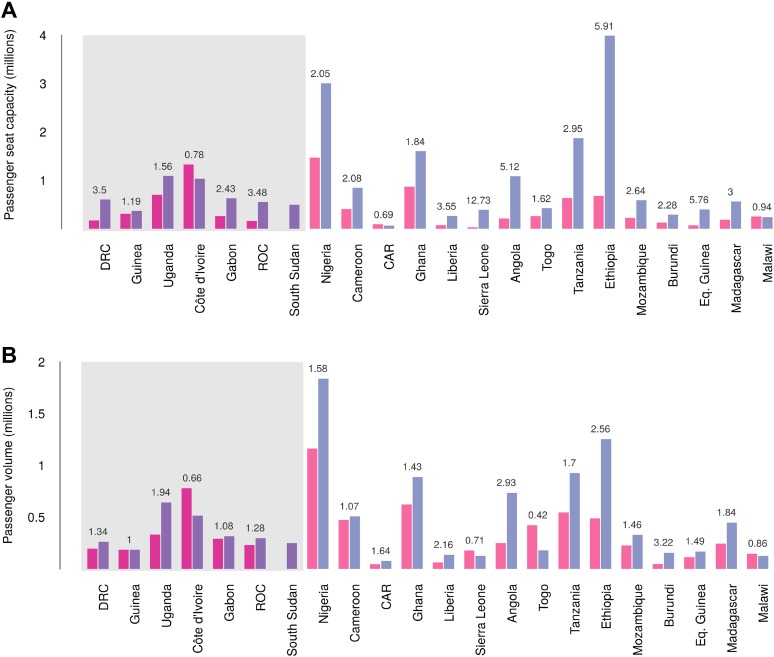
Ebola virus disease (EVD) is a complex zoonosis that is highly virulent in humans. The largest recorded outbreak of EVD is ongoing in West Africa, outside of its previously reported and predicted niche. We assembled location data on all recorded zoonotic transmission to humans and Ebola virus infection in bats and primates (1976-2014). Using species distribution models, these occurrence data were paired with environmental covariates to predict a zoonotic transmission niche covering 22 countries across Central and West Africa. Vegetation, elevation, temperature, evapotranspiration, and suspected reservoir bat distributions define this relationship. At-risk areas are inhabited by 22 million people; however, the rarity of human outbreaks emphasises the very low probability of transmission to humans. Increasing population sizes and international connectivity by air since the first detection of EVD in 1976 suggest that the dynamics of human-to-human secondary transmission in contemporary outbreaks will be very different to those of the past.

Keywords: Ebola; Ebola virus; boosted regression trees; disease mapping; epidemiology; global health; human; infectious disease; microbiology; niche based modelling; species distribution modelling; viruses.


Conflict of interest statement

SIH: Reviewing editor, eLife.

The other authors declare that no competing interests exist.

Figures

Figure 1.
Figure 1.. The epidemiology of Ebola virus transmission in Africa.
Of the suspected reservoir species, 1, 2 and 3 represent the three bat species from which Ebola virus has been isolated (Hypsignathus monstrosus, Myonycteris torquata and Epomops franqueti) and n represents unknown reservoirs of the disease yet to be discovered. Of the susceptible species, A represents Pan troglodytes, B Gorilla gorilla and m represents other organisms susceptible to the disease, such as duikers. H represents humans. Blue arrows indicate unknown transmission cycles or infection routes and red arrow routes have been confirmed or are suspected. Adapted from Groseth et al. (2007). DOI: http://dx.doi.org/10.7554/eLife.04395.003
Figure 2.
Figure 2.. The locations of Ebola virus disease outbreaks in humans in Africa.
(A) Illustrates the 23 reported outbreaks of Ebola virus disease through time, with the area of each circle and its position along the y-axis representing the number of cases. The onset year is represented by the colour as per (B). (B) Shows a map of the index cases for each of these outbreaks. (CH) Show these outbreaks over a series of time periods. Numbers refer to outbreaks as listed in Table 1. In (BH) the species of Ebola virus responsible for the outbreak is illustrated by the symbol shape, the number of resulting cases and onset date by symbol colour. The most recent outbreak (#23) is indicated in orange. Countries in which zoonotic transmission to humans has been reported or is assumed to have occurred are coloured in blue. In each map the Democratic Republic of Congo is outlined for reference. DOI: http://dx.doi.org/10.7554/eLife.04395.005
Figure 3.
Figure 3.. The locations of reported Ebola virus infection in animals in Africa.
(A) Shows the locations of reported Ebola virus infection in animals. (BD) Show these records in animals over three different time periods. Numbers refer to records as listed in Table 2. In all panels, the species in which infection was detected is given by symbol shape and the year recorded by symbol colour. Blue countries represent locations where zoonotic transmission to humans has been reported or is assumed to have occurred. In each map the Democratic Republic of Congo is outlined for reference. DOI: http://dx.doi.org/10.7554/eLife.04395.007
Figure 4.
Figure 4.. Predicted geographical distribution of the three species of Megachiroptera suspected to reservoir Ebola virus.
(A) Shows the distribution of the hammer-headed bat (Hypsignathus monstrosus), (B) The little collared fruit bat (Myonycteris torquata) and (C) Franquet's epauletted fruit bat (Epomops franqueti). In each map, the locations of reported observations of each species, extracted and curated from the Global Biodiversity Information Facility (GBIF, 2014) and used to train each model are given as grey points (H. monstrosus, n = 67; E. franqueti, n = 120 and M. torquata, n = 52). Expert opinion maps of the known range of each species, generated by the IUCN (Schipper et al., 2008), are outlined in grey. The colour legend represents a scale of the relative probability that the species occurs in that location from 0 (white, low) to 1 (green, high). Area under the curve statistics, calculated under a stringent ten-fold cross validation procedure, are 0.63 ± 0.04, 0.59 ± 0.04 and 0.58 ± 0.03 for H. monstrosus, M. torquata and E. franqueti respectively. (D) Is a composite distribution map giving the mean, relative probability of occurrence from (AC). DOI: http://dx.doi.org/10.7554/eLife.04395.008
Figure 5.
Figure 5.. Predicted geographical distribution of the zoonotic niche for Ebola virus.
(A) Shows the total populations living in areas of risk of zoonotic transmission for each at-risk country. The grey rectangle highlights countries in which index cases of Ebola virus disease have been reported (Set 1); the remainder are countries in which risk of zoonotic transmission is predicted, but in which index cases of Ebola have not been reported (Set 2). These countries are ranked by population at risk within each set. The population at risk Figure in 100,000 s is given above each bar. (B) Shows the predicted distribution of zoonotic Ebola virus. The scale reflects the relative probability that zoonotic transmission of Ebola virus could occur at these locations; areas closer to 1 (red) are more likely to harbour zoonotic transmission than those closer to 0 (blue). Countries with borders outlined are those which are predicted to contain at-risk areas for zoonotic transmission based on a thresholding approach (see ‘Materials and methods’). The area under the curve statistic, calculated under a stringent 10-fold cross-validation procedure is 0.85 ± 0.04. Solid lines represent Set 1 whilst dashed lines delimit Set 2. Areas covered by major lakes have been masked white. DOI: http://dx.doi.org/10.7554/eLife.04395.009
Figure 5—figure supplement 1.
Figure 5—figure supplement 1.. Covariates used in predicting zoonotic transmission niche of Ebola.
(A) Displays elevation across Africa measured in metres, relative to sea level. (B and C) Show enhanced vegetation index (EVI) values (mean and spatial range respectively) on a scale from 0 to 1. (DG) Display land surface temperature (LST) (mean and spatial range for day and night respectively) measured in degrees Celsius. (H) Shows potential evapotranspiration (PET) for Africa, in millimetres per month and (I) gives the composite, relative probability of occurrence of the three suspected reservoir bat species. For details of how each of these covariate layers was derived see ‘Materials and methods’. DOI: http://dx.doi.org/10.7554/eLife.04395.010
Figure 5—figure supplement 2.
Figure 5—figure supplement 2.. Marginal effect plots for each covariate used in the Ebola virus distribution model.
Each panel illustrates the marginal effect (averaging over the effects of other covariates) that changes in each of the covariates has on the predicted relative probability of occurrence of zoonotic Ebola virus transmission. Grey regions and solid lines give the 95% confidence region (a metric of uncertainty) and mean value calculated across all 500 submodels. The mean relative contribution of the covariate to the model (the proportion of iterations in which the covariate was selected by the model-fitting algorithm, indicating sensitivity to the covariates) is given as an inset number. The dependency plots are ordered by mean relative contribution of the covariate. EVI = enhanced vegetation index, LST = land surface temperature and PET = potential evapotranspiration. DOI: http://dx.doi.org/10.7554/eLife.04395.011
Figure 5—figure supplement 3.
Figure 5—figure supplement 3.. Comparison of predictions for zoonotic niche of Ebola virus excluding the Guinea outbreak.
(A) Shows the predicted zoonotic niche excluding the index case for the Guinea outbreak from the dataset used to train the model. (B) Shows the prediction when including the Guinea data in the model (the model presented in Figure 5). The circle depicts the location of the Guinean index case (#23 in Table 1). As per Figure 5, the scale reflects the relative probability that zoonotic transmission of Ebola virus could occur at these locations; areas closer to 1 (red) are more likely to harbour zoonotic transmission than those closer to 0 (blue). DOI: http://dx.doi.org/10.7554/eLife.04395.012
Figure 6.
Figure 6.. Changes in national population for countries predicted to contain areas at-risk of zoonotic Ebola virus transmission.
For each country the population (in millions) is presented for three time periods (1976, 2000 and 2014) as three bars. Each stacked bar gives the rural (green) and urban (blue) populations of the country. The grey rectangle highlights countries in which index cases of Ebola virus diseases have been reported (Set 1); the remainder are countries in which risk of zoonotic transmission is predicted, but where index cases have not been reported (Set 2). The fractional change in population between 1976 and 2014 is given above each set of bars. DOI: http://dx.doi.org/10.7554/eLife.04395.013
Figure 7.
Figure 7.. Changes in international flight capacity and traveller volumes for countries predicted to contain areas at-risk of zoonotic Ebola virus transmission.
The grey rectangle highlights countries in which index cases of EVD have been reported (Set 1). The remainder are countries in which risk of zoonotic transmission is predicted, but where index cases have not been reported (Set 2). (A) Shows changes in annual outbound international seat capacity (between 2000 in red and 2013 in blue). (B) Depicts changes in annual outbound international passenger volume by country (between 2005 in red and 2012 in blue). For each country, the fractional change in volume is given above each set of bars. Note that only one bar is presented for South Sudan as data for this region prior to formation of the country in 2011 were unavailable. DOI: http://dx.doi.org/10.7554/eLife.04395.014
Figure 8.
Figure 8.. Numbers of airline passengers arriving from at-risk countries to other countries stratified by major geographic regions and national income groups.
(A) Shows the locations of WHO regions (AFRO–African Region; AMRO–Region of the Americas; EMRO–Eastern Mediterranean Region; EURO–European Region; SEARO–South-East Asian Region; WPRO–Western Pacific Region). (B) Displays the numbers of passengers arriving in each of these regions from countries predicted to contain areas at risk of zoonotic Ebola virus transmission (Sets 1 and 2) in 2005 and 2012. (C) Shows the income tiers of all countries as defined by the World Bank. (D) Displays the total numbers of passengers arriving in countries in each of these income strata from at-risk countries in 2005 and 2012. The number above each pair of bars indicates the fractional change in these numbers of incoming passengers between 2005 and 2012. DOI: http://dx.doi.org/10.7554/eLife.04395.015

Comment in

Similar articles

Cited by

References

    1. Amblard J, Obiang P, Edzang S, Prehaud C, Bouloy M, Guenno BL. 1997. Identification of the Ebola virus in Gabon in 1994. Lancet 349:181–182. doi: 10.1016/S0140-6736(05)60984-1 - DOI - PubMed
    1. Baize S, Pannetier D, Oestereich L, Rieger T, Koivogui L, Magassouba N, Soropogui B, Sow MS, Keïta S, De Clerck H, Tiffany A, Dominguez G, Loua M, Traoré A, Kolié M, Malano ER, Heleze E, Bocquin A, Mély S, Raoul H, Caro V, Cadar D, Gabriel M, Pahlmann M, Tappe D, Schmidt-Chanasit J, Impouma B, Diallo AK, Formenty P, Van Herp M, Günther S. 2014. Emergence of Zaire Ebola virus disease in Guinea - preliminary report. The New England Journal of Medicine doi: 10.1056/NEJMoa1404505 - DOI - PubMed
    1. Bannister B. 2010. Viral haemorrhagic fevers imported into non-endemic countries: risk assessment and management. British Medical Bulletin 95:193–225. doi: 10.1093/Bmb/Ldq022 - DOI - PubMed
    1. Barbet-Massin M, Jiguet F, Albert CH, Thuiller W. 2012. Selecting pseudo-absences for species distribution models: how, where and how many? Methods in Ecology and Evolution 3:327–338. doi: 10.1111/j.2041-210X.2011.00172.x - DOI
    1. Baron RC, McCormick JB, Zubeir OA. 1983. Ebola virus disease in southern Sudan: hospital dissemination and intrafamilial spread. Bulletin of the World Health Organization 61:997–1003 - PMC - PubMed

Publication types

MeSH terms