. 2014 Sep 23;111(38):13906-11.
doi: 10.1073/pnas.1409362111. Epub 2014 Sep 8.

Evolution of ibrutinib resistance in chronic lymphocytic leukemia (CLL)

Affiliations

Evolution of ibrutinib resistance in chronic lymphocytic leukemia (CLL)

Natalia L Komarova et al. Proc Natl Acad Sci U S A. .

Abstract

The Bruton tyrosine kinase inhibitor (BTKi) ibrutinib is a new targeted therapy for patients with chronic lymphocytic leukemia (CLL). Ibrutinib is given orally on a continuous schedule and induces durable remissions in the majority of CLL patients. However, a small proportion of patients initially responds to the BTKi and then develops resistance. Estimating the frequency, timing, and individual risk of developing resistance to ibrutinib, therefore, would be valuable for long-term management of patients. Computational evolutionary models, based on measured kinetic parameters of patients, allow us to approach these questions and to develop a roadmap for personalized prognosis and treatment management. Our kinetic models predict that BTKi-resistant mutants exist before initiation of ibrutinib therapy, although they only comprise a minority of the overall tumor burden. Furthermore, we can estimate the time required for resistant cells to grow to detectable levels. We predict that this can be highly variable, depending mostly on growth and death rates of the individual CLL cell clone. For a specific patient, this time can be predicted with a high degree of certainty. Our model can thus be used to predict for how long ibrutinib can suppress the disease in individual patients. Furthermore, the model can suggest whether prior debulking of the tumor with chemo-immunotherapy can prolong progression-free survival under ibrutinib. Finally, by applying the models to data that document progression during ibrutinib therapy, we estimated that resistant mutants might have a small (<2%) mean fitness advantage in the absence of treatment, compared with sensitive cells.

Keywords: drug resistance; evolutionary dynamics; mathematical models; personalized medicine; stochastic dynamics.


Conflict of interest statement

The authors declare no conflict of interest.

Figures
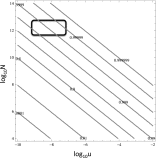
Fig. 1.
Fig. 1.
Probability of resistance generation. The horizontal axis is the log10 of the mutation rate, and the vertical axis is the log10 of the colony size at detection. Because these two parameters vary within many orders-of-magnitude, we calculated the probability of resistance generation. The latter is presented as a contour plot, where the contours (with the values marked next to them) represent constant-level sets of probability. The black rectangle in the upper left corner represents the parameter values relevant for CLL. The division and death parameters for wild-type and mutant cells are given by lw = lr = 1 and dw = dr = 0.1. The results do not change visibly if we take lw = lr = 1, dw = dr = 0.
Fig. 2.
Fig. 2.
A histogram of mutant population sizes: (A) at start of treatment and (B) after 300 d of treatment. Plotted are results for a population of 1,000 artificial “patients” (with parameters from refs. and 17). Blue histograms correspond to the assumption that resistant mutants are neutral and red, that they have a 1.5% fitness advantage in the absence of treatment. The vertical bar in B marks the mean value of the plateau of CLL cells achieved upon treatment in ref. . The mutation rate is 10−8.
Fig. 3.
Fig. 3.
Numerically obtained probability distribution function for the expected time when a resistant colony reaches detection level, for different combinations of kinetic parameters. The artificial patient population of 1,000 was created as in Fig. 2; the mutation rate is 10−8. (A) The probability density function. (B) The cumulative distribution function.
Fig. 4.
Fig. 4.
The growth dynamics of resistant mutants. (A and B) The mean growth dynamics of mutants calculated for 100 parameter combinations, created as in Fig. 2. The mutation rate is 10−8. The detection threshold of 1010 cells is marked by a horizontal line. In A, the resistant mutants are neutral in the absence of treatment, and in B they have a fitness advantage of 1.5%. (C) The inverse time of mutant detection is plotted against the net growth rate, lw − dw for all of the “patients” in A. (D) Same as in C, but plotted against the tumor size at the start of treatment. In panels C and D we assume that the mutants are neutral in the absence of treatment.
Fig. 5.
Fig. 5.
Stochasticity of mutant dynamics. (A) Histograms of the simulated number of mutants at the start of treatment (when the colony reaches size 8 × 10¹²). (B and C) The histograms of the time it takes for the mutant colony to reach the detection level of 109 cells. Two parameter combinations have been simulated: “slow” (lw = lr = 0.0029, dw = dr = 0.0026) and “fast” (lw = lr = 0.0178, dw = dr = 0.0106). The total number of simulations is about 5,000 for each parameter set. The mutation rate is assumed to be 10−8. For each measurement, for “fast” and “slow” parameters, the mean ± SD is indicated.
Fig. 6.
Fig. 6.
Dynamics of resistance. (A) The probability of one-drug resistance to be generated in a colony of CLL cells before treatment, as a function of the population size. The different lines correspond to different values of the cellular turnover, dw/lw, taken from the nine sets of parameters in ref. . The vertical line marks the detection size, 109 cells. (B) Circles: The probability of one-drug resistance for different values of the turnover (horizontal axis) at size n = 109. Squares: The probability of two-drug resistance for different values of the turnover at size n = 8 × 10¹². (C) Same as in A, but for the probability of two-drug resistance. The vertical line marks the mean treatment size in ref. , 8 × 10¹². (D) Numerically obtained probability distribution function for the expected time when a resistant colony reaches level 1010, after reducing the tumor size by a factor of 0.01 by debulking (compare with Fig. 3A in the absence of debulking). The mutation rate is 10−8.

References

    1. Burger JA, Chiorazzi N. B cell receptor signaling in chronic lymphocytic leukemia. Trends Immunol. 2013;34(12):592–601. - PMC - PubMed
    1. Chiorazzi N, Rai KR, Ferrarini M. Chronic lymphocytic leukemia. N Engl J Med. 2005;352(8):804–815. - PubMed
    1. Pan Z, et al. Discovery of selective irreversible inhibitors for Bruton’s tyrosine kinase. ChemMedChem. 2007;2(1):58–61. - PubMed
    1. Honigberg LA, et al. The Bruton tyrosine kinase inhibitor PCI-32765 blocks B-cell activation and is efficacious in models of autoimmune disease and B-cell malignancy. Proc Natl Acad Sci USA. 2010;107(29):13075–13080. - PMC - PubMed
    1. Burger JA, Buggy JJ. Bruton tyrosine kinase inhibitor ibrutinib (PCI-32765) Leuk Lymphoma. 2013;54(11):2385–2391. - PubMed

Publication types

MeSH terms