. 2014 Sep 23;111(38):E3986-95.
doi: 10.1073/pnas.1406535111. Epub 2014 Sep 8.

Motor coupling through lipid membranes enhances transport velocities for ensembles of myosin Va

Affiliations

Motor coupling through lipid membranes enhances transport velocities for ensembles of myosin Va

Shane R Nelson et al. Proc Natl Acad Sci U S A. .

Abstract

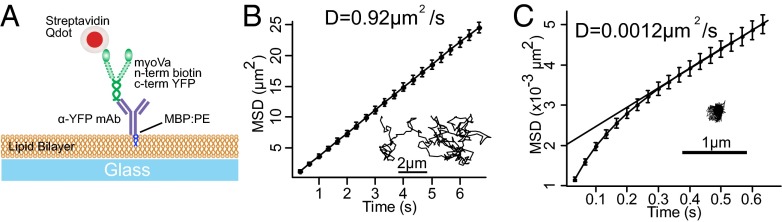
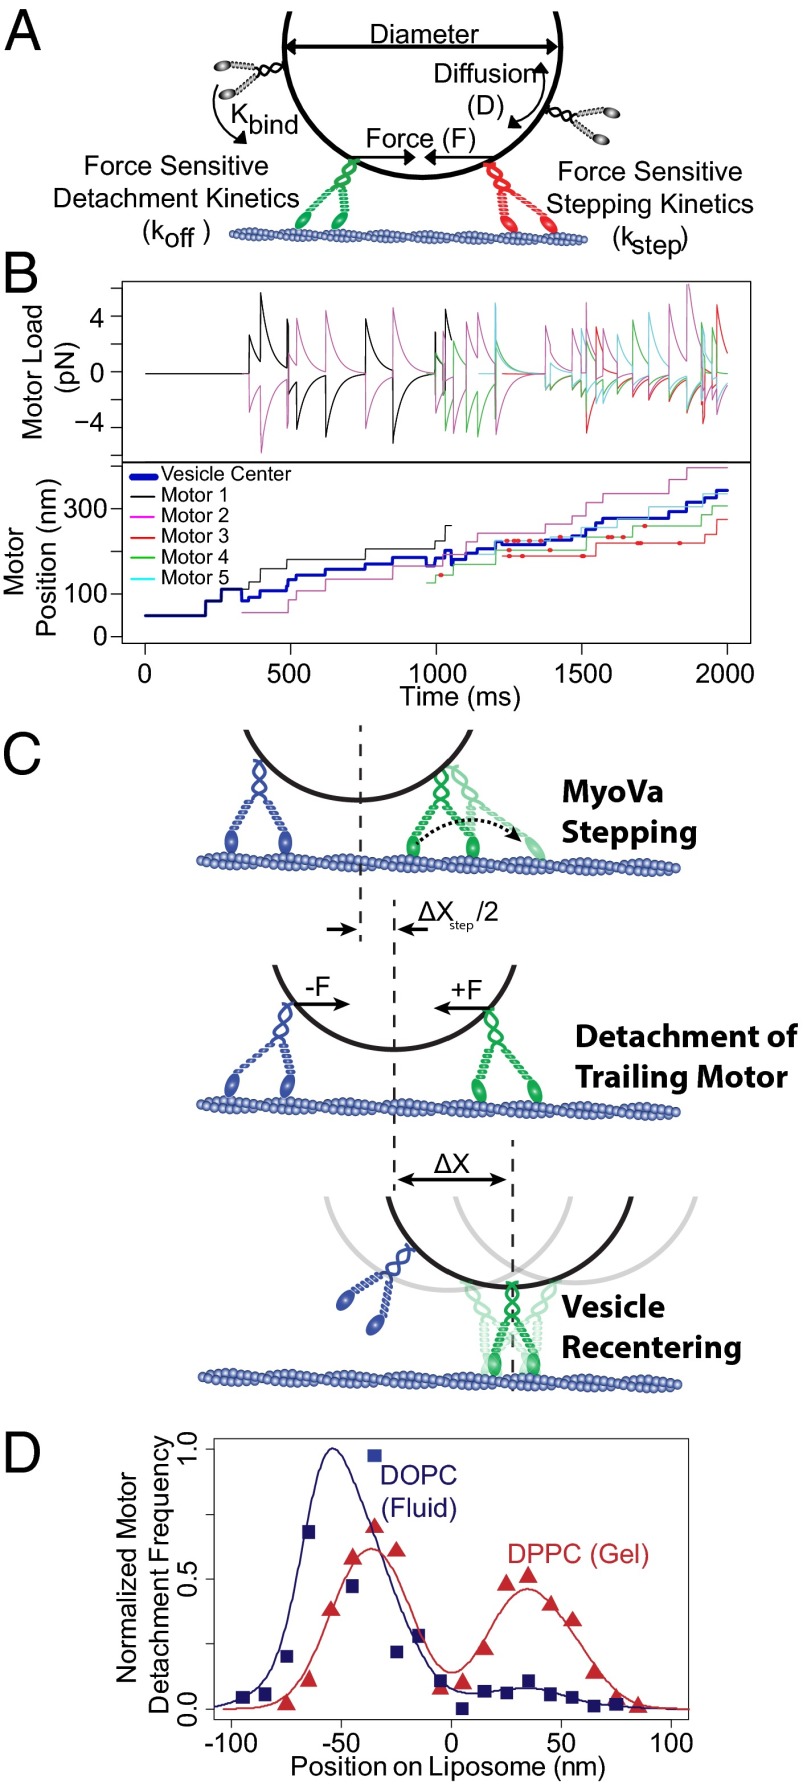
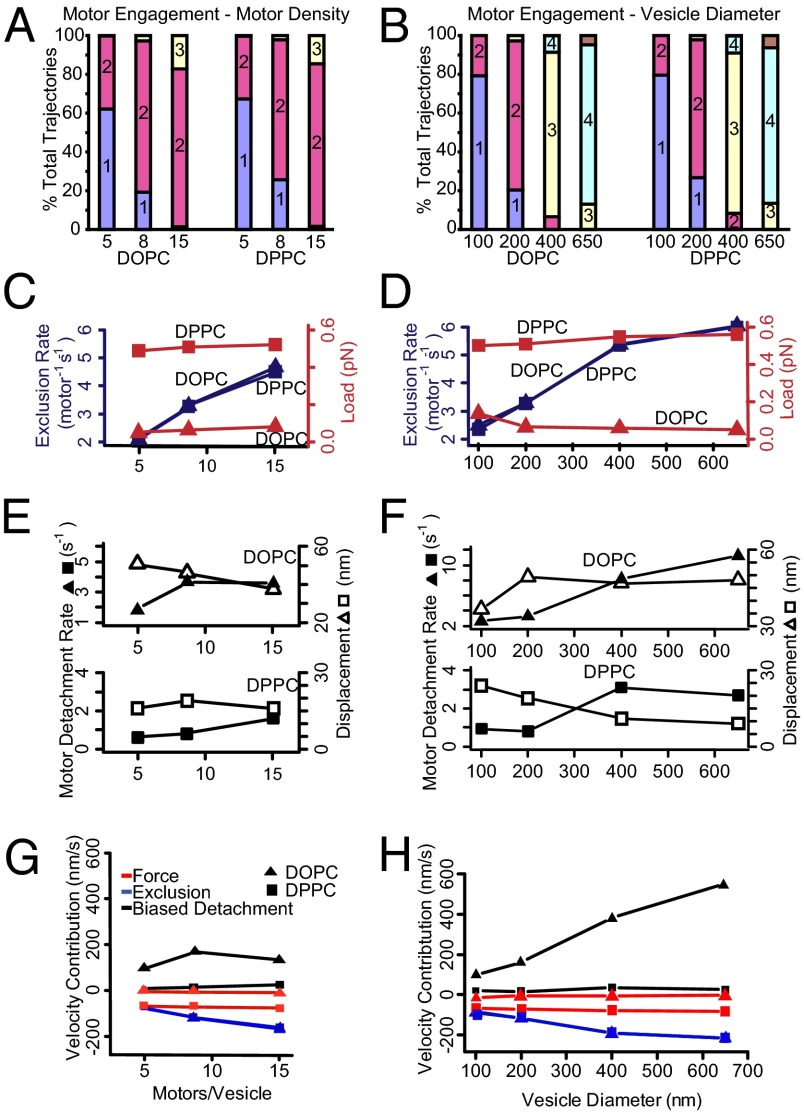
Myosin Va is an actin-based molecular motor responsible for transport and positioning of a wide array of intracellular cargoes. Although myosin Va motors have been well characterized at the single-molecule level, physiological transport is carried out by ensembles of motors. Studies that explore the behavior of ensembles of molecular motors have used nonphysiological cargoes such as DNA linkers or glass beads, which do not reproduce one key aspect of vesicular systems--the fluid intermotor coupling of biological lipid membranes. Using a system of defined synthetic lipid vesicles (100- to 650-nm diameter) composed of either 1,2-dioleoyl-sn-glycero-3-phosphocholine (DOPC) (fluid at room temperature) or 1,2-dipalmitoyl-sn-glycero-3-phosphocholine (DPPC) (gel at room temperature) with a range of surface densities of myosin Va motors (32-125 motors per μm(2)), we demonstrate that the velocity of vesicle transport by ensembles of myosin Va is sensitive to properties of the cargo. Gel-state DPPC vesicles bound with multiple motors travel at velocities equal to or less than vesicles with a single myosin Va (∼450 nm/s), whereas surprisingly, ensembles of myosin Va are able to transport fluid-state DOPC vesicles at velocities significantly faster (>700 nm/s) than a single motor. To explain these data, we developed a Monte Carlo simulation that suggests that these reductions in velocity can be attributed to two distinct mechanisms of intermotor interference (i.e., load-dependent modulation of stepping kinetics and binding-site exclusion), whereas faster transport velocities are consistent with a model wherein the normal stepping behavior of the myosin is supplemented by the preferential detachment of the trailing motor from the actin track.

Keywords: actin filament; liposome.


Conflict of interest statement

The authors declare no conflict of interest.

Figures

Fig. 1.
Fig. 1.
Determination of the number of motors per vesicle. (A) Time courses of integrated fluorescence intensity for three representative 200-nm DOPC vesicles coupled to YFP-labeled myoVa at a mixing ratio of eight myoVas per vesicle. (B) Variance in normalized fluorescence intensity between photobleaching time courses for 295 vesicles. (C) Ensemble averaged variance normalized to initial intensity (σ2/Io), vs. photobleached fraction [P = e(−t/τ)]. See SI Methods for details. (D) Mean integrated initial intensity of 200-nm vesicles incubated with myoVa at molar ratios ranging from 4 to 32 motors per vesicle (dark bars; normalized to mean = 1.0). Error bars indicate SEM. The light bars indicate integrated intensity per fluorophore (v) (see SI Methods for details). (E) Resulting number of myoVa motor molecules per vesicle (assuming two YFPs per myoVa motor, i.e., one YFP per myoVa heavy chain).
Fig. 2.
Fig. 2.
Vesicle model system, motility, tracking, and analysis. (A) Cartoon illustrating attachment of myoVa heavy meromyosin (HMM) molecules to phospholipid vesicles using SH-NaV. (B) Time-lapse of vesicle (red) moving on a single actin filament (green) in a flow cell. The lower panel shows X–Y tracking results (black dots) of the vesicle trajectory, shown with polynomial fit (red curve). (C) Displacement vs. time plot (right trace) demonstrates two “pause” periods (red lines) with an overall velocity of 366 nm/s (determined by regression; dashed black line). Removing the “paused” periods (left trace) yields a velocity (460 nm/s) that describes the periods during vesicle motion. Inset shows a kymograph of multiple vesicles traveling along the same actin filament and pausing at the same location.
Fig. 3.
Fig. 3.
Vesicle velocity distributions demonstrate two populations. (A) Velocity distributions are statistically indistinguishable (P > 0.05) for single Qdot-labeled myoVa (black), Qdot-labeled myoVa with 200-nm DOPC vesicles added to the motility buffer (red), and 200-nm DOPC vesicles coupled to a limiting amount of myoVa, such that the majority of vesicles are coupled to a single motor (green). (B) Cumulative frequency distributions demonstrate that the observed velocities of 200-nm DOPC vesicles coupled to a single myoVa molecule are well described as a single-Gaussian population (blue fit to black data), whereas with increased numbers of motors, both DOPC and DPPC vesicle populations (200-nm diameter; eight motors per vesicle) are much better described as the sum of two Gaussian populations (red curves, nearly obscuring black data) than a single Gaussian (blue curves). These fits are supported by the large residuals that result from fitting a single-Gaussian population (Insets, colored to match distributions; tic marks on vertical axis indicate increments of 0.1), and an LLRT (P < 0.001), which indicates that the two-Gaussian fit is appropriate for both vesicle compositions (P < 0.01), but not the single motor case (P > 0.05). (C) Velocity distributions for 200-nm DOPC vesicles with eight motors per vesicle are nearly identical regardless of whether they are calculated on a per-trajectory basis or a “time-weighted” basis, and yield nearly identical fitted values. The green curve indicates the velocity distribution generated by the Monte Carlo simulation of vesicle motility, as well as the two constituent Gaussian populations (dashed lines).
Fig. 4.
Fig. 4.
Experimental and simulated velocities of fast and slow populations for vesicles of different composition, size, and motor density. Mean velocities for both fast and slow populations from both experiment (left side) and simulation (right side), as a function of motor density for 200-nm vesicles (A) and as a function of vesicle diameter keeping the motor surface density constant at 64 motors per µm2 (B). Error bars indicate SEM. Total number of trajectories for each experimental condition is reported above the bars, whereas the relative proportions of the fast and slow populations are reported near the bottom of each bar. The horizontal dashed line indicates the velocity of a 200-nm DOPC vesicle transported by a single myoVa.
Fig. 5.
Fig. 5.
Lipid-anchored myoVas diffuse freely on DOPC membranes. (A) Cartoon illustrating experimental setup of planar supported lipid bilayers. (B) Mean-squared displacement (MSD) analysis and sample trajectory (Inset) of Qdot-labeled myoVa molecule diffusing in a DOPC membrane with an apparent diffusion coefficient, D, shown. However, motors tethered to a bilayer of gel-state DPPC (C) show minimal detectable movement.
Fig. 6.
Fig. 6.
Monte Carlo simulation. (A) Cartoon illustrating interactions of myoVa motor molecules used for Monte Carlo simulation. (B) Representative trajectory of a 200-nm DPPC vesicle, indicating forces experienced by each actin-engaged motor (Upper, positive forces indicate resistive loads) and the spatial arrangement of each actin-engaged motor, as well as the vesicle center (Lower). The red dots indicate events where an attempted processive step was obstructed by the presence of another motor. (C) Cartoon illustrating the proposed mechanisms for enhanced vesicular transport velocity. Processive stepping of either attached motor (only lead motor stepping indicated in figure) results in net forward movement of the cargo. Intermotor forces cause an acceleration of detachment for the trailing motor. Upon trailing motor detachment, Brownian motion of the vesicle leads to a rapid recentering of the vesicle over the remaining bound motor(s), generating a net forward displacement (ΔX). As additional motors engage the track, the process is allowed to repeat. (D) Frequency of motor detachment relative to center position of the liposome. Motor detachment from the track is more frequent among trailing motors on fluid-state DOPC vesicles, whereas there is little detachment bias among leading and trailing motors on gel-state DPPC vesicles.
Fig. 7.
Fig. 7.
Model mechanisms that alter vesicle velocity. (A and B) Median motor engagement is predicted by the simulation on a per-trajectory basis and increases only slightly with increasing motor number and more so with increasing vesicle diameter. The colored bars indicate the proportion of trajectories that have a median number of engaged motors over the course of the trajectory. (C and D) Reductions in velocity are attributable to two main mechanisms—one load-based modulation of motor stepping rate and one based on obstruction of actin-binding sites so as to limit a motor’s forward step. For each vesicle condition simulated, the median absolute load experienced by each motor (red) is strongly influenced by vesicle composition, whereas the frequency of obstructed steps (blue) increases with both motor density and vesicle diameter. (E) The trailing motor detachment rate (closed symbols) is accelerated with increasing motor density on DOPC vesicles. However, the net vesicle movement upon trail motor detachment (ΔX, open symbols) decreases with motor density. Similar trends are predicted for DPPC vesicles but the absolute values are lower. (F) As in E, the trailing motor detachment rate (closed symbols) is dramatically accelerated with DOPC vesicle diameter. However, the net vesicle movement upon trailing motor detachment (ΔX, open symbols) remains nearly constant. Therefore, the enhancement of vesicle velocity for increasing DOPC vesicle diameters is governed by the trailing motor detachment rate (see H). The contribution of this effect is minimal for DPPC vesicles. (G and H) Predicted changes to vesicle velocities attributable solely due to biased detachment of trailing motors (black), load-based modulation of motors’ stepping kinetics (red), and actin-binding site exclusion of motor stepping (blue).

Similar articles

Cited by

References

    1. Desnos C, Huet S, Darchen F. “Should I stay or should I go?”: Myosin V function in organelle trafficking. Biol Cell. 2007;99(8):411–423. - PubMed
    1. Li JF, Nebenführ A. The tail that wags the dog: The globular tail domain defines the function of myosin V/XI. Traffic. 2008;9(3):290–298. - PubMed
    1. Nascimento AA, Amaral RG, Bizario JC, Larson RE, Espreafico EM. Subcellular localization of myosin-V in the B16 melanoma cells, a wild-type cell line for the dilute gene. Mol Biol Cell. 1997;8(10):1971–1988. - PMC - PubMed
    1. Tabb JS, Molyneaux BJ, Cohen DL, Kuznetsov SA, Langford GM. Transport of ER vesicles on actin filaments in neurons by myosin V. J Cell Sci. 1998;111(Pt 21):3221–3234. - PubMed
    1. Gross SP, et al. Interactions and regulation of molecular motors in Xenopus melanophores. J Cell Biol. 2002;156(5):855–865. - PMC - PubMed

Publication types

MeSH terms

Substances

LinkOut - more resources