Clinical Trial
. 2014 Sep 23;111(38):E4006-14.
doi: 10.1073/pnas.1413561111. Epub 2014 Sep 8.

Genetic, anatomic, and clinical determinants of human serum sterol and vitamin D levels

Affiliations
Clinical Trial

Genetic, anatomic, and clinical determinants of human serum sterol and vitamin D levels

Ashlee R Stiles et al. Proc Natl Acad Sci U S A. .

Abstract

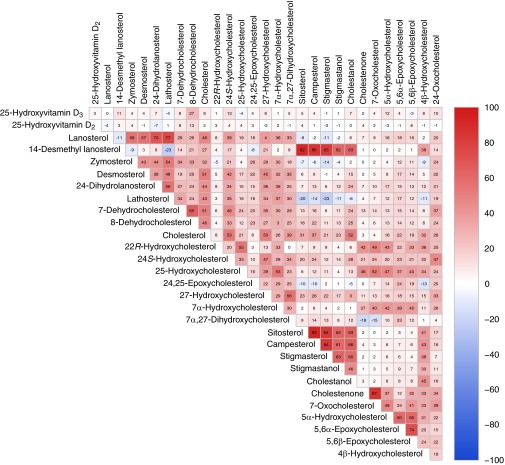
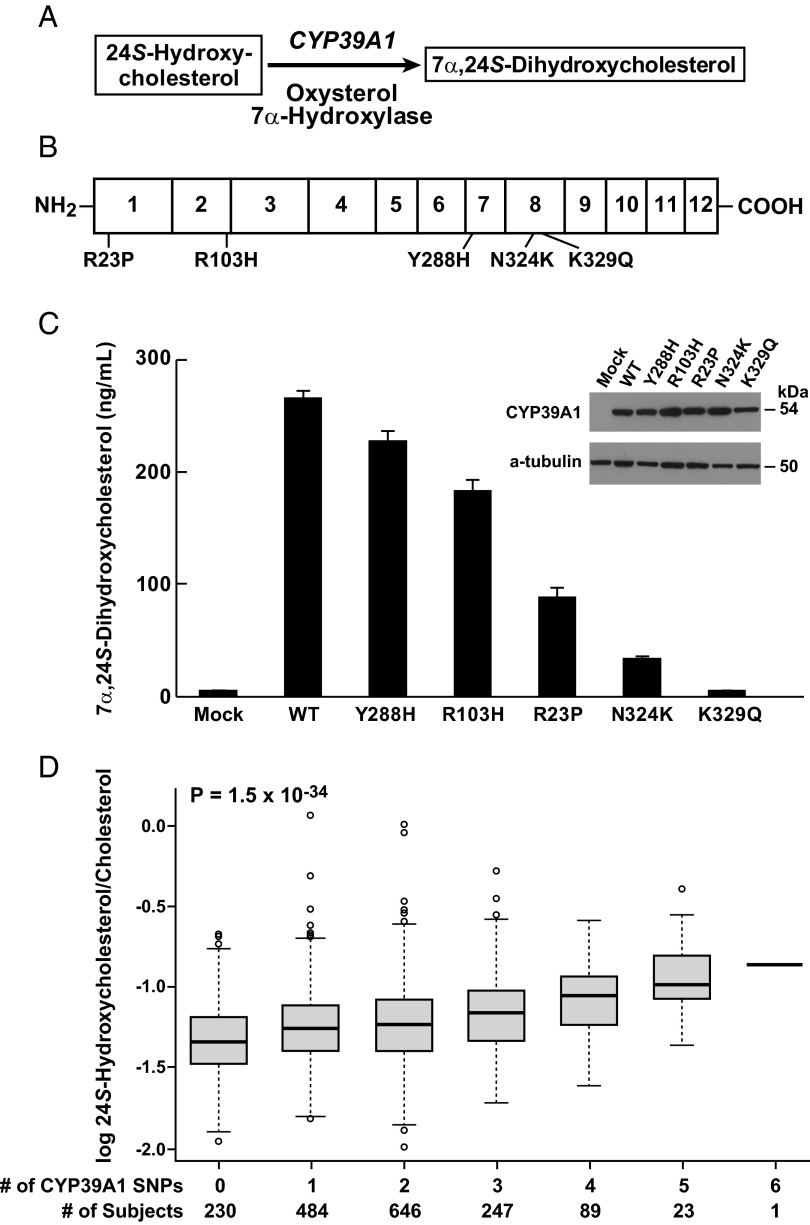
An unknown fraction of the genome participates in the metabolism of sterols and vitamin D, two classes of lipids with diverse physiological and pathophysiological roles. Here, we used mass spectrometry to measure the abundance of >60 sterol and vitamin D derivatives in 3,230 serum samples from a well-phenotyped patient population. Twenty-nine of these lipids were detected in a majority of samples at levels that varied over thousands of fold in different individuals. Pairwise correlations between sterol and vitamin D levels revealed evidence for shared metabolic pathways, additional substrates for known enzymes, and transcriptional regulatory networks. Serum levels of multiple sterols and vitamin D metabolites varied significantly by sex, ethnicity, and age. A genome-wide association study identified 16 loci that were associated with levels of 19 sterols and 25-hydroxylated derivatives of vitamin D (P < 10(-7)). Resequencing, expression analysis, and biochemical experiments focused on one such locus (CYP39A1), revealed multiple loss-of-function alleles with additive effects on serum levels of the oxysterol, 24S-hydroxycholesterol, a substrate of the encoded enzyme. Body mass index, serum lipid levels, and hematocrit were strong phenotypic correlates of interindividual variation in multiple sterols and vitamin D metabolites. We conclude that correlating population-based analytical measurements with genotype and phenotype provides productive insight into human intermediary metabolism.

Keywords: genotype–phenotype correlation; human genetics.


Conflict of interest statement

The authors declare no conflict of interest.

Figures

Fig. 1.
Fig. 1.
Distribution of serum 24S-hydroxycholesterol levels in 3,230 DHS participants. (A) Raw data showing 24S-hydroxycholesterol levels in individual subjects. (B) Correlation between serum cholesterol and 24S-hydroxycholesterol levels in individuals. (C) Distribution of 24S-hydroxycholesterol levels after normalization to cholesterol levels. The red line shows the probability density function for the best-fitting log-normal distribution. (D) Normalized distribution following log transformation of 24S-hydroxycholesterol/cholesterol levels. The red line shows the probability density function for the best-fitting normal distribution.
Fig. 2.
Fig. 2.
Pairwise correlations between serum levels of analyte. Values are Spearman’s rank correlation coefficients (r) × 100 between the indicated pairs of analytes; r values for individual comparisons are depicted using a bipolar color progression as indicated by the scale on the right of the figure. Values greater than ±4 are statistically different from 0 at a 5% significance level.
Fig. 3.
Fig. 3.
Effects of sex, ethnicity, and age on analytes levels. Box and whisker plots depict median values for the indicated analyte (thick black bars), first-third quartile (interquartile range, box), 5th and 95th percentiles (thin horizontal lines), and outliers beyond this range (x). In sex comparisons: F, female; M, male. In ethnicity comparisons: AA, African American; EA, European American; HIS, Hispanic. R2 values indicate the percentage of variance explained by each of the indicated covariates. P values indicate significance of the observed relationship.
Fig. 4.
Fig. 4.
Chromosomal locations of genes significantly linked to individual lipid levels. Schematics of human chromosomes stained with Giemsa are shown together with the locations of genes significantly linked (P ≤ 10−7) to individual sterol and vitamin D metabolite levels, which are color-coded at the bottom of the figure.
Fig. 5.
Fig. 5.
Expression analysis of genetic variants linked to high serum 24S-hydroxycholesterol levels. (A) Biochemical reaction catalyzed by the CYP39A1 oxysterol 7α-hydroxylase. (B) Schematic of the 500-aa CYP39A1 protein showing the sequences and locations of the five variants (rs12192544, R23P; rs2277119, R103H; rs17856332, Y288H; rs7761731, N324K; rs41273654, K329Q) identified in individuals with high levels of 24S-hydroxycholesterol. (C) Expression analysis of normal and variant enzymes. Plasmids expressing normal (N) and the indicated variant CYP39A1 enzymes were transfected into cultured HEK 293 cells and assayed for oxysterol 7α-hydroxylase activity. Inset shows levels of CYP39A1 protein in transfected cells as determined by immunoblotting; α-tubulin served as a loading control. (D) Cumulative effects of multiple SNPs on serum levels of 24S-hydroxycholesterol. Log-normalized serum levels of the oxysterol (y axis) are indicated by whisker plots showing median values (thick black bars), first-third quartile (interquartile range, box), 5th and 95th percentiles (thin horizontal lines), and outliers beyond this range (open circles), and are plotted versus the total number of CYP39A1 SNPs present in an individual (x axis). The number of subjects who inherited a given number of SNPs is indicated at the bottom of the plot.
Fig. 6.
Fig. 6.
Pairwise correlations between serum levels of analytes and clinical phenotypes. Values are partial correlation coefficients × 100 after adjustment for age, sex, and ethnicity between the indicated pairs of analytes and clinical parameters; r values for individual comparisons are depicted using a bipolar color progression as indicated by the scale below the figure. Only traits for which at least one r value was greater than or equal to ±10 are shown.

References

    1. Quehenberger O, et al. Lipidomics reveals a remarkable diversity of lipids in human plasma. J Lipid Res. 2010;51(11):3299–3305. - PMC - PubMed
    1. McDonald JG, Smith DD, Stiles AR, Russell DW. A comprehensive method for extraction and quantitative analysis of sterols and secosteroids from human plasma. J Lipid Res. 2012;53(7):1399–1409. - PMC - PubMed
    1. Garcia CK, et al. Autosomal recessive hypercholesterolemia caused by mutations in a putative LDL receptor adaptor protein. Science. 2001;292(5520):1394–1398. - PubMed
    1. Berge KE, et al. Accumulation of dietary cholesterol in sitosterolemia caused by mutations in adjacent ABC transporters. Science. 2000;290(5497):1771–1775. - PubMed
    1. He G, et al. ARH is a modular adaptor protein that interacts with the LDL receptor, clathrin, and AP-2. J Biol Chem. 2002;277(46):44044–44049. - PubMed

Publication types

LinkOut - more resources