. 2014 Sep 23;111(38):E4053-61.
doi: 10.1073/pnas.1406077111. Epub 2014 Sep 8.

Visual stimuli recruit intrinsically generated cortical ensembles

Affiliations

Visual stimuli recruit intrinsically generated cortical ensembles

Jae-eun Kang Miller et al. Proc Natl Acad Sci U S A. .

Abstract

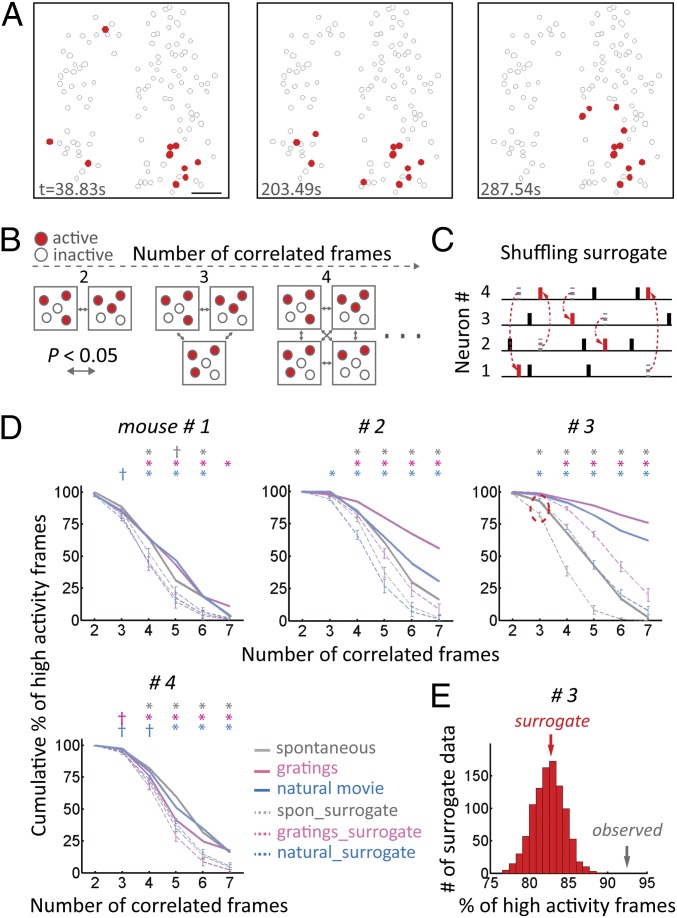
The cortical microcircuit is built with recurrent excitatory connections, and it has long been suggested that the purpose of this design is to enable intrinsically driven reverberating activity. To understand the dynamics of neocortical intrinsic activity better, we performed two-photon calcium imaging of populations of neurons from the primary visual cortex of awake mice during visual stimulation and spontaneous activity. In both conditions, cortical activity is dominated by coactive groups of neurons, forming ensembles whose activation cannot be explained by the independent firing properties of their contributing neurons, considered in isolation. Moreover, individual neurons flexibly join multiple ensembles, vastly expanding the encoding potential of the circuit. Intriguingly, the same coactive ensembles can repeat spontaneously and in response to visual stimuli, indicating that stimulus-evoked responses arise from activating these intrinsic building blocks. Although the spatial properties of stimulus-driven and spontaneous ensembles are similar, spontaneous ensembles are active at random intervals, whereas visually evoked ensembles are time-locked to stimuli. We conclude that neuronal ensembles, built by the coactivation of flexible groups of neurons, are emergent functional units of cortical activity and propose that visual stimuli recruit intrinsically generated ensembles to represent visual attributes.

Keywords: V1; assemblies; mouse; reverberation.


Conflict of interest statement

The authors declare no conflict of interest.

Figures

Fig. 1.
Fig. 1.
Imaging neuronal ensembles. (A) Illustration of a head-fixed awake imaging setup. Mice were presented with a black screen or visual stimulation with drifting gratings or a natural movie. Head fixation was omitted from the drawing for clarity. (B) Two-photon microscopic image of a typical field of view from bolus-loaded cells in layer 2/3 of V1. The Oregon Green Bapta-1 AM (OGB-1) dye labeled both neurons and astrocytes, and the red SR101 dye labeled only astrocytes. (Scale bar, 50 μm.) (C) ROIs (yellow) overlaid on the image. (D) Spike probability (color-coded) of 102 neurons in an example of a single frame (frame 491) during spontaneous activity. Spike probability was inferred from calcium signals using a spike inference algorithm (Materials and Methods). Spike probability was then thresholded to a level of 3 SDs above 0, as detailed in Materials and Methods, and converted to 1 (active) or 0 (inactive). These binary activity data were used for the subsequent analyses unless otherwise indicated. (E) Ensemble of coactive neurons after applying a threshold to D. In a given frame, the red color denotes active neurons and the gray contour denotes inactive neurons. (F) ∆F/F trace from neuron 31 during spontaneous activity. (G) Inferred spike probability from the same neuron. (H) Raster plot of spontaneous activity constructed using thresholded spike probability data. Each row represents a single neuron, and each mark represents neuronal activity. a.u., arbitrary unit. (I) Percentage of neurons coactive in each frame. The red line indicates the threshold for a statistically significant number of coactive cells in a frame (Materials and Methods). A total of 4.07 frames were imaged per second, and the field of view was 317.44 × 317.44 μm.
Fig. 2.
Fig. 2.
Ensemble properties. (A) Raster plots of the activity from 121 imaged neurons in an awake mouse under three different conditions [spontaneous (Top), drifting gratings (Middle), and natural movie (Bottom); not drawn to spatial scale for purposes of clarity]. The activity of an ensemble is marked in red. (B) Number of ensembles per second in spontaneous, gratings, and natural movie conditions. (C) Percentage of active neurons per ensemble. (D) Mean ∆F/F of neurons. In the gratings condition, only the stimulus period was included for analysis. Data are mean ± SEM [n = 7 mice, 86 ± 8 neurons per mouse (mean ± SEM)]. **P < 0.01, Wilcoxon signed-rank test.
Fig. 3.
Fig. 3.
Ensembles repeat. (A) Example of similar ensembles occurring during spontaneous activity. t, time during image acquisition. (Scale bar, 50 μm.) (B) Schematic illustrating significantly correlated frames as the number of frames compared increases. (C) Schematic illustrating the shuffling method. In surrogate data, activities between neurons were randomly exchanged while preserving both the number of active neurons in a given frame and the total amount of activity in a given neuron. Black lines denote the original activities conserved in the shuffled trace, red lines denote new activities after shuffling, and dotted lines denote activities removed by shuffling. (D) Correlated ensembles occur more frequently than by chance. The y axis shows the percentage of high-activity frames that participated in correlations, and the x axis shows the number of correlated frames. Dotted lines denote the mean of the 1,000 surrogate datasets. Data are mean ± SD [n = 7 mice (data from three mice are shown in Fig. S2A)]. P < 0.05; *P < 0.005. spon, spontaneous. (E) Example of a histogram of the percentage of surrogate high-activity frames that participated in three-time correlations in the spontaneous condition from mouse 3 (red dotted circle in D). Note that surrogate and observed data do not overlap. Each experiment was recorded for 13.08 ± 0.3 min (mean ± SEM).
Fig. 4.
Fig. 4.
Ensembles cannot be explained by firing properties of individual neurons. (A) Example of correlated ensembles [spontaneous (Top), drifting gratings (Middle), and natural movie (Bottom)]. The red color denotes an ensemble in a given frame, and the green contour denotes a core ensemble, defined as a group of coactive neurons that are conserved in all significantly correlated ensembles. (Scale bar, 50 μm.) (B) Distributions of the predicted probability that a core ensemble would be coactive, calculated based on the individual firing properties of neurons in isolation (blue) vs. the observed probability that a core ensemble was coactive (red). Mean predicted probabilities were 0.0006 ± 0.0003, 0.007 ± 0.005, and 0.002 ± 0.001, and mean observed probabilities were 0.0020 ± 0.000, 0.017 ± 0.005, and 0.010 ± 0.002 for the spontaneous, drifting gratings, and natural movie conditions, respectively (P < 0.005 and n = 7 for the spontaneous and gratings conditions, and P < 0.05 and n = 4 for the natural movie condition; Wilcoxon signed-rank test; mean ± SEM).
Fig. 5.
Fig. 5.
Individual neurons flexibly participate in multiple ensembles. (A) Example of correlated ensembles [spontaneous (Top), drifting gratings (Middle), and natural movie (Bottom)]. The red color denotes an ensemble in a given frame, the green contour denotes a core ensemble (also Fig. 4), and the blue contour denotes neurons that were shared in multiple core ensembles. (Scale bar, 50 μm.) (B) Percentage of neurons that were shared in multiple core ensembles evoked by distinctly oriented gratings with a difference in orientation of 45° vs. 90° (n = 7 mice). (C) Mean OSI (n = 7). (D) Percentage of neurons that were shared in multiple core ensembles evoked by distinct natural scenes (n = 4). Data are mean ± SEM.
Fig. 6.
Fig. 6.
Visually evoked ensembles are similar to spontaneous ensembles. (A) Schematic illustrating ensembles that are correlated in both spontaneous and visual stimulation conditions. (B) Correlated evoked ensembles are also similar to correlated spontaneous ensembles above chance level. The y axis shows the percentage of evoked high-activity (h.a.) frames that participated in matching correlations between evoked and spontaneous data, and the x axis shows the number of correlated frames. Dotted lines denote the mean percentage of evoked high-activity frames that participated in matching correlations between real evoked data and 100 spontaneous surrogate datasets. Data are mean ± SD (n = 7 mice; data from three mice are shown in Fig. S5A). P < 0.05; *P < 0.005. (C) Example ensemble frames with a significant correlation between the natural movie and spontaneous conditions. Only two ensemble frames were included for purposes of clarity, although more were correlated. (Scale bar, 50 μm.)
Fig. 7.
Fig. 7.
Temporal occurrence of ensembles. Correlated spontaneous ensembles reoccurred at random time intervals, whereas correlated evoked ensembles reoccurred when an identical stimulus was represented. (A) Spontaneous ensembles. (B) Ensembles evoked by drifting gratings (a session of four distinctly oriented gratings looped every 20 s). (C) Ensembles evoked by the looped natural movie (30 s in length). Data from six mice were pooled.
Fig. 8.
Fig. 8.
Model illustrating that visual stimuli recruit ensembles from a spontaneous lexicon. In this proposed model, when a visual stimulus reaches the cortex, it activates individual components of an ensemble, each of which is relatively unreliable in isolation. Through recurrent connections, an entire ensemble is then activated, recruited from the spontaneously active lexicon of ensembles. The two examples shown are actual cortical responses to distinct visual stimuli and highlight the fact that individual neurons contribute to multiple ensembles. (Scale bar, 50 μm.)

References

    1. Hebb DO. The Organization of Behaviour. New York: Wiley; 1949.
    1. Uhlhaas PJ, et al. Neural synchrony in cortical networks: History, concept and current status. Front Integr Neurosci. 2009;3:17. - PMC - PubMed
    1. Buzsáki G. Neural syntax: Cell assemblies, synapsembles, and readers. Neuron. 2010;68(3):362–385. - PMC - PubMed
    1. Lorente de Nó R. Cerebral cortex: Architecture, intracortical connections, motor projections. In: Fulton JF, editor. Physiology of the Nervous System. 3rd Ed. New York: Oxford Univ Press; 1949. pp. 228–330.
    1. Douglas RJ, Martin KAC, Markram H. Neocortex. In: Shepherd GM, editor. The Synaptic Organization of the Brain. 5th Ed. Oxford: Oxford Univ Press; 2004. pp. 499–558.

Publication types