. 2014 Oct 24;289(43):29483-505.
doi: 10.1074/jbc.M114.603480. Epub 2014 Sep 8.

Transglutaminase II/microRNA-218/-181a loop regulates positive feedback relationship between allergic inflammation and tumor metastasis

Affiliations

Transglutaminase II/microRNA-218/-181a loop regulates positive feedback relationship between allergic inflammation and tumor metastasis

Sangkyung Eom et al. J Biol Chem. .

Abstract

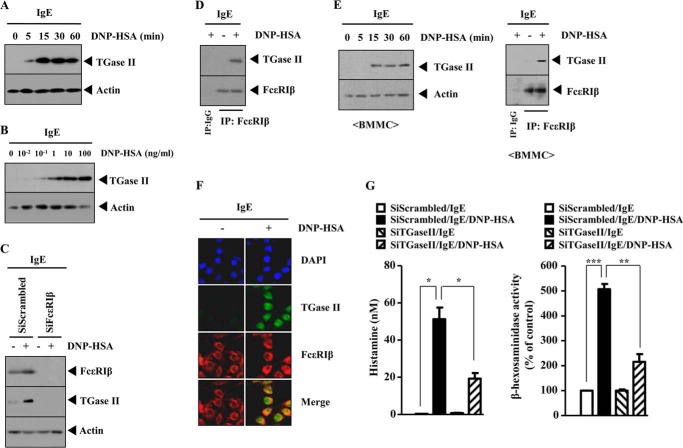
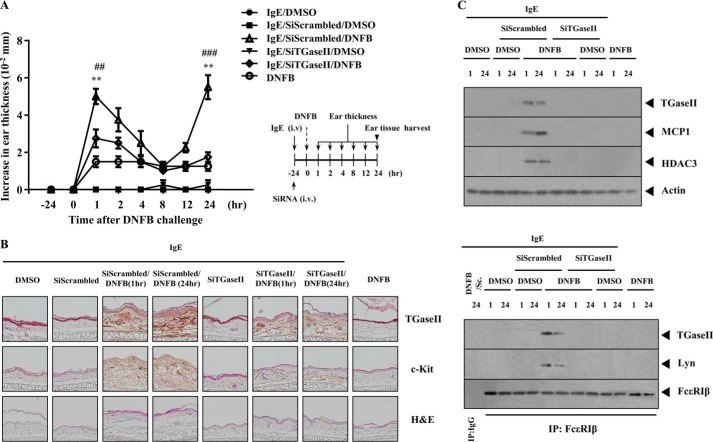
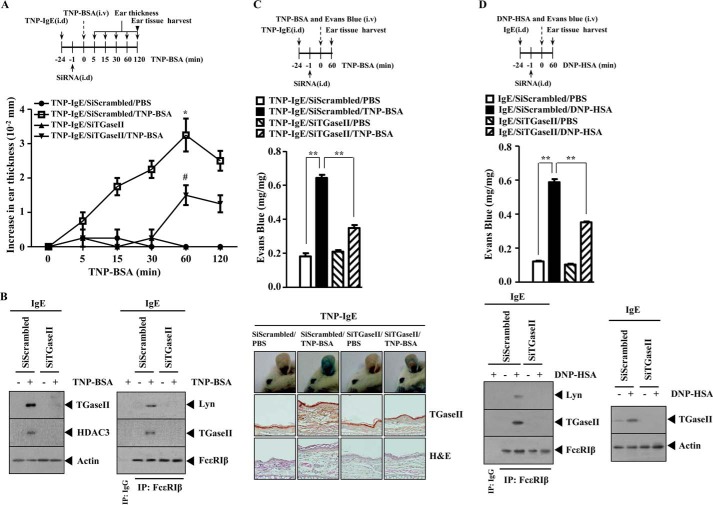
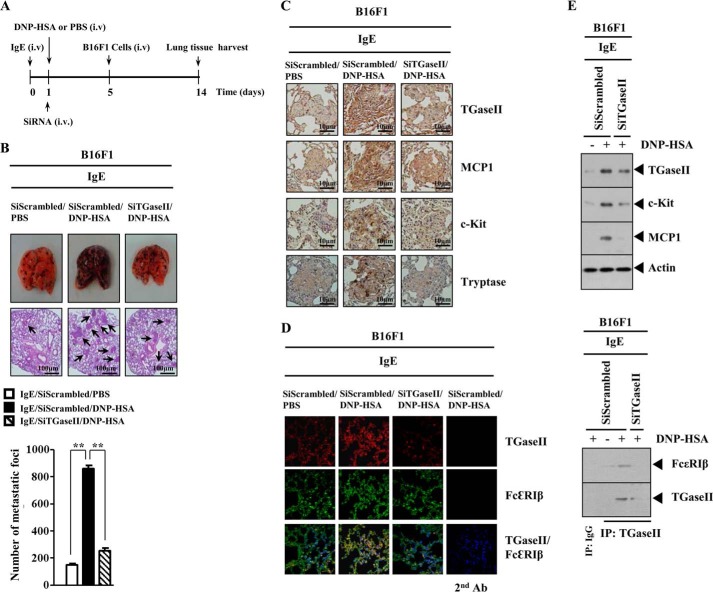
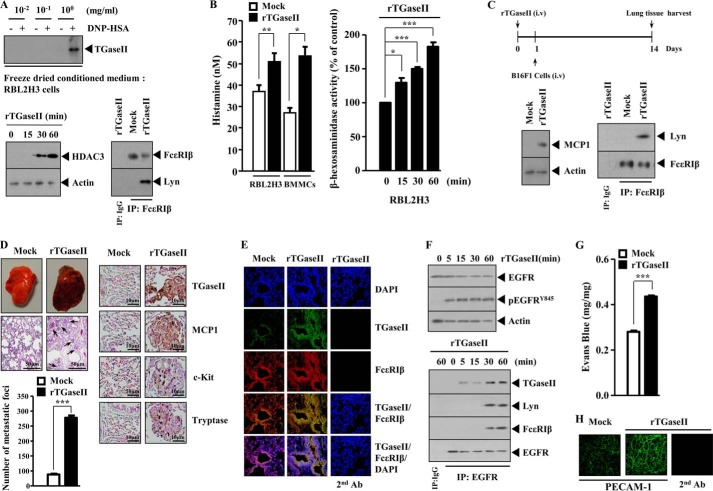
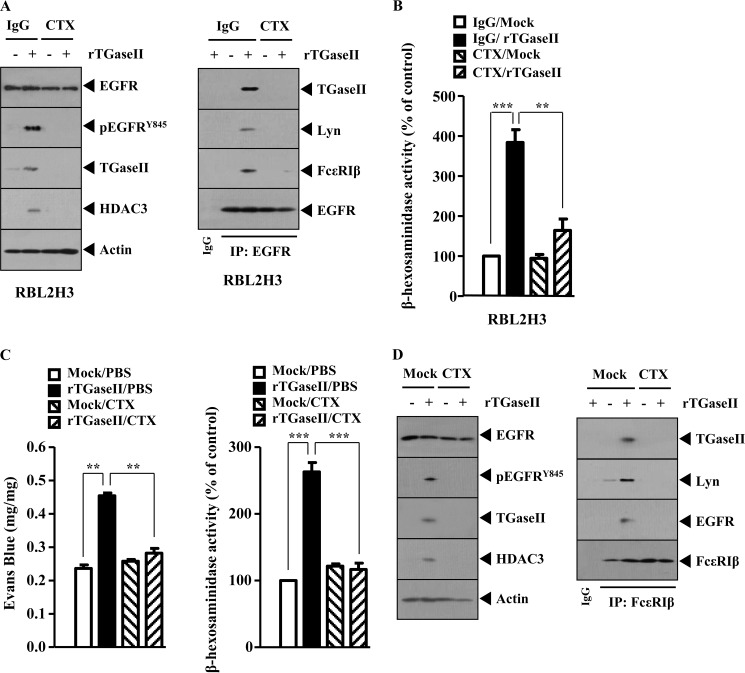
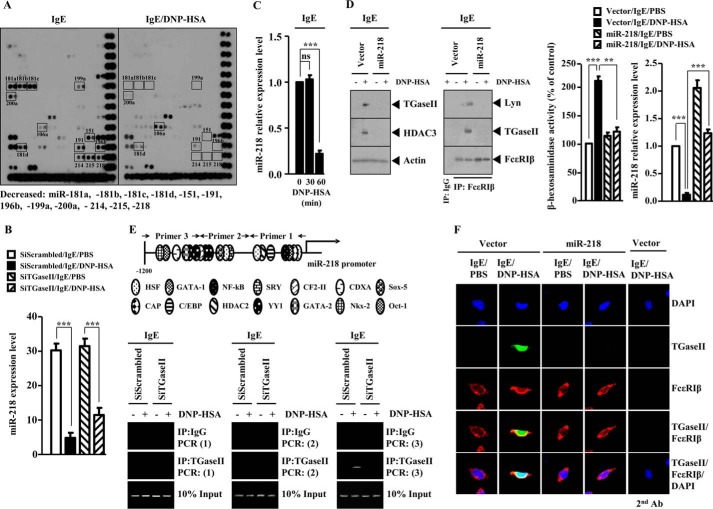
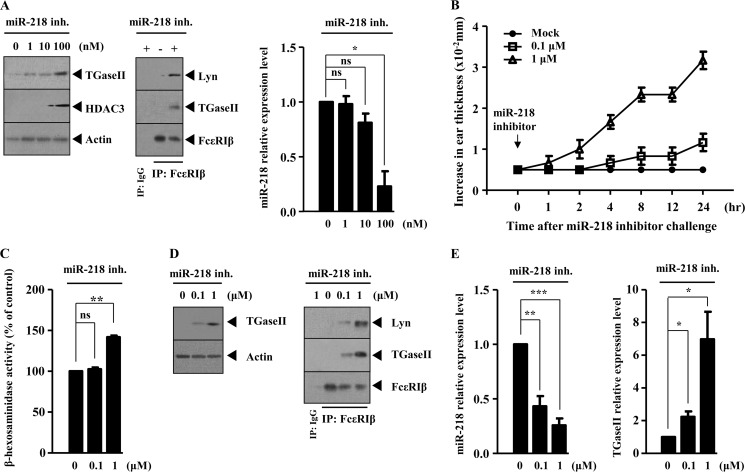
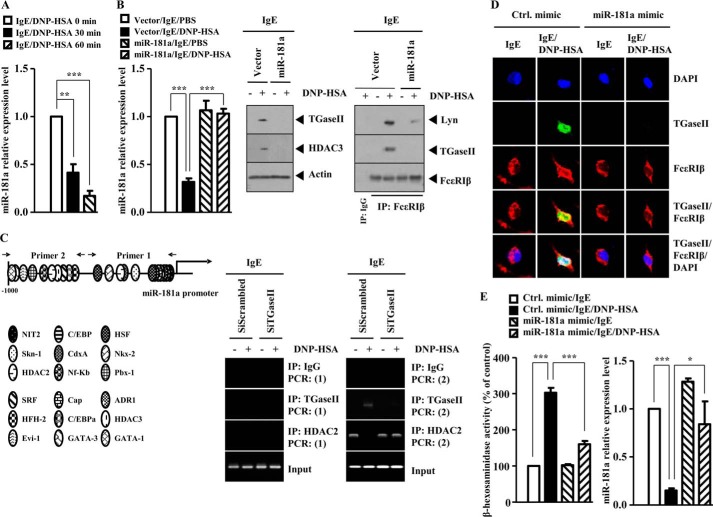
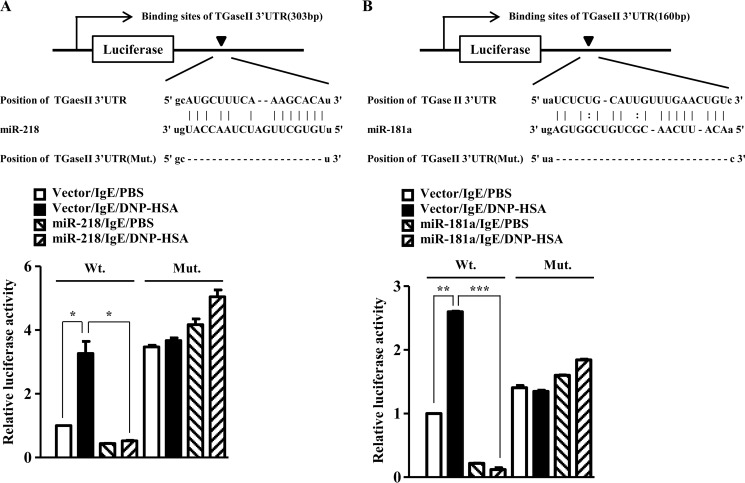
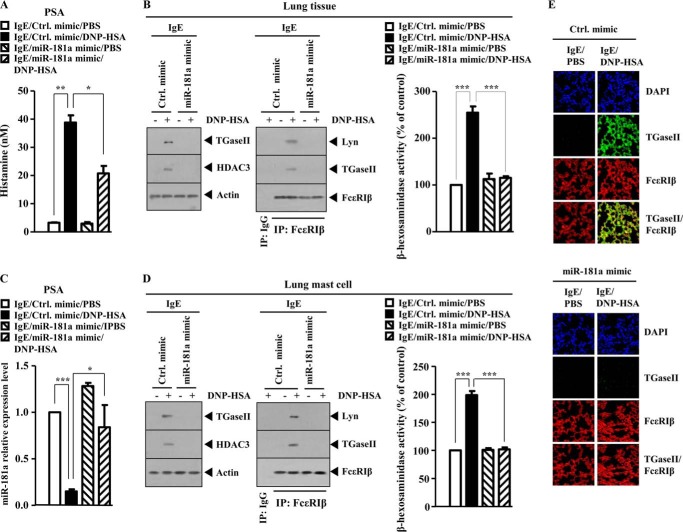
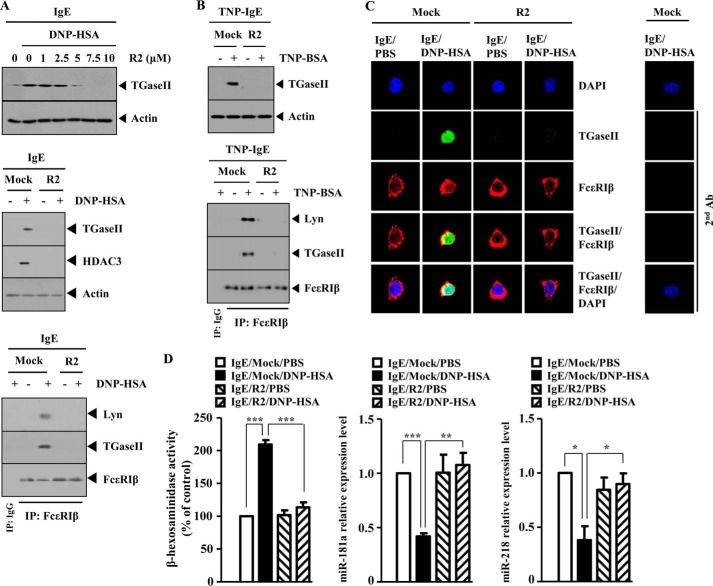
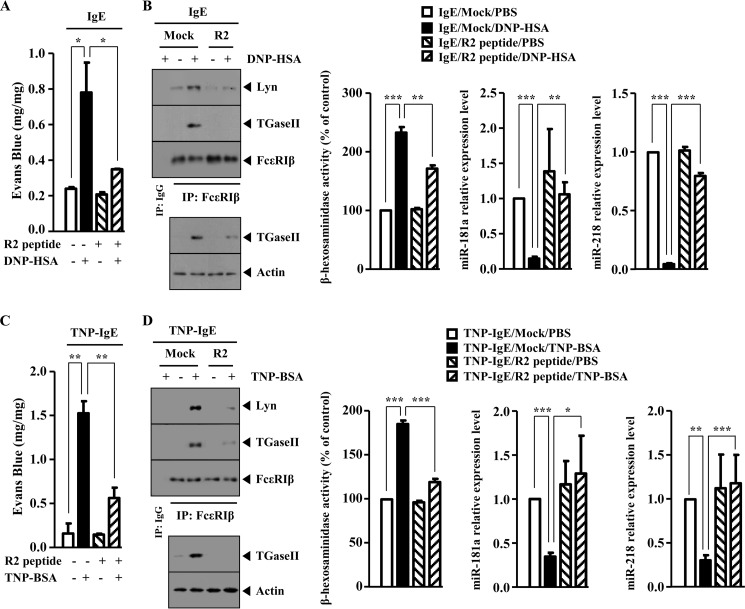
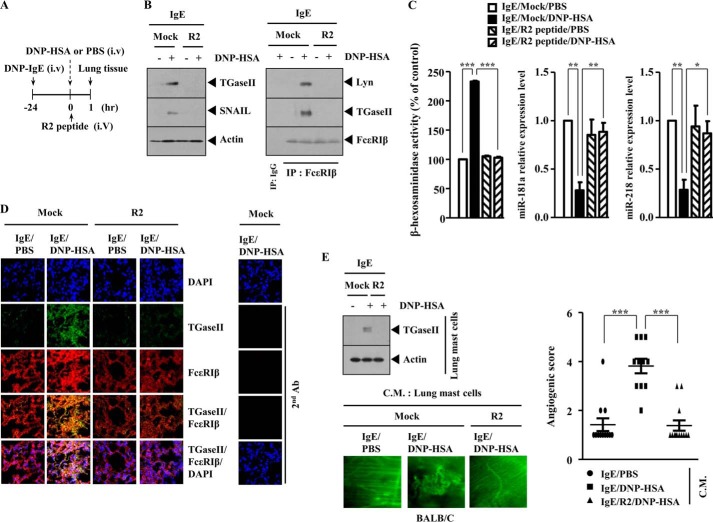
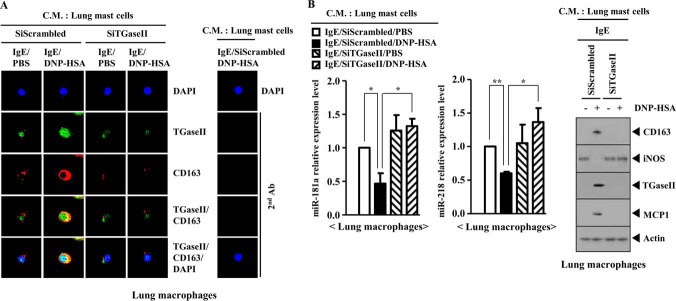
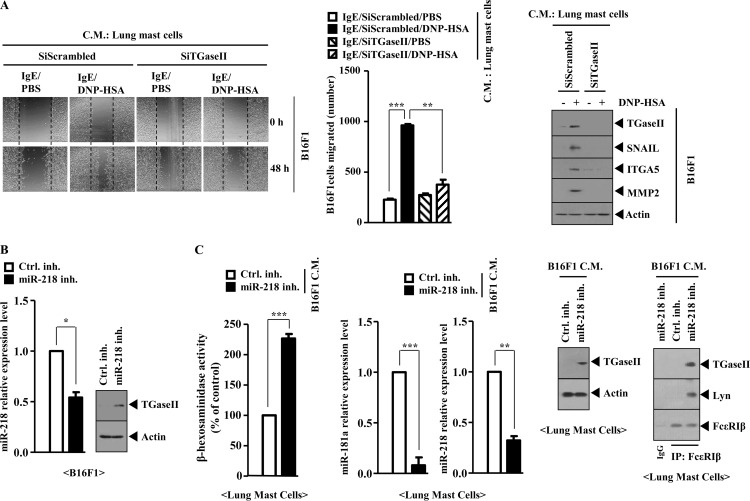
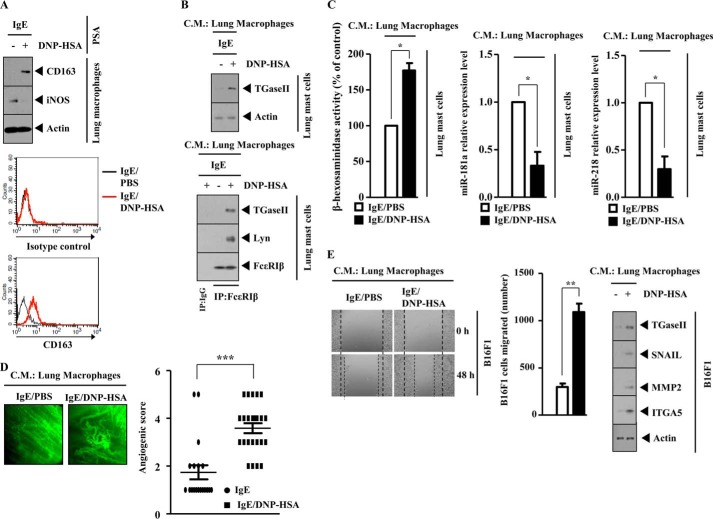
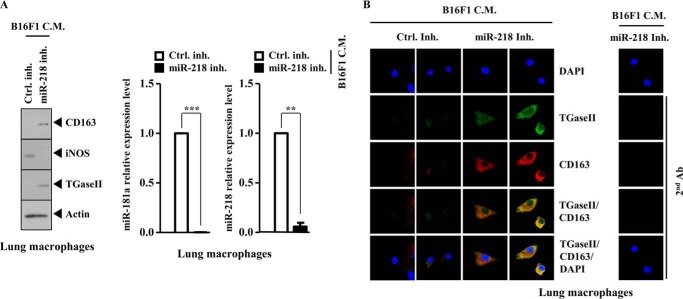
The molecular mechanism of transglutaminase II (TGaseII)-mediated allergic inflammation remains largely unknown. TGaseII, induced by antigen stimulation, showed an interaction and co-localization with FcϵRI. TGaseII was necessary for in vivo allergic inflammation, such as triphasic cutaneous reaction, passive cutaneous anaphylaxis, and passive systemic anaphylaxis. TGaseII was necessary for the enhanced metastatic potential of B16F1 melanoma cells by passive systemic anaphylaxis. TGaseII was shown to be a secreted protein. Recombinant TGaseII protein increased the histamine release and β-hexosaminidase activity, and enhanced the metastatic potential of B16F1 mouse melanoma cells. Recombinant TGaseII protein induced the activation of EGF receptor and an interaction between EGF receptor and FcϵRI. Recombinant TGaseII protein displayed angiogenic potential accompanied by allergic inflammation. R2 peptide, an inhibitor of TGaseII, exerted negative effects on in vitro and in vivo allergic inflammation by regulating the expression of TGaseII and FcϵRI signaling. MicroRNA (miR)-218 and miR-181a, decreased during allergic inflammation, were predicted as negative regulators of TGaseII by microRNA array and TargetScan analysis. miR-218 and miR-181a formed a negative feedback loop with TGaseII and regulated the in vitro and in vivo allergic inflammation. TGaseII was necessary for the interaction between mast cells and macrophages during allergic inflammation. Mast cells and macrophages, activated during allergic inflammation, were responsible for the enhanced metastatic potential of tumor cells that are accompanied by allergic inflammation. In conclusion, the TGaseII/miR-218/-181a feedback loop can be employed for the development of anti-allergy therapeutics.

Keywords: Allergic Inflammation; Angiogenesis; Gene Regulation; Macrophage; Mast Cell; MicroRNA-181a; MicroRNA-218; Transglutaminase II; Tumor Metastasis.


Figures

FIGURE 1.
FIGURE 1.
TGaseII is induced by antigen stimulation and interacts with FcϵRIβ. A, RBL2H3 cells were sensitized with DNP-specific IgE (100 ng/ml). The next day, cells were then stimulated with DNP-HSA (100 ng/ml) for various time intervals. Cell lysates prepared at each time point were subjected to Western blot analysis. B, the IgE-sensitized RBL2H3 cells were stimulated with various concentrations of DNP-HSA (100 ng/ml) for 1 h. Cell lysates prepared were subjected to Western blot analysis. C, RBL2H3 cells were transiently transfected with the indicated siRNA (10 nm each) prior to sensitization with DNP-specific IgE (100 ng/ml). The IgE-sensitized RBL2H3 cells were then stimulated with DNP-HSA (100 ng/ml) for 1 h, followed by Western blot analysis. D, the IgE-sensitized RBL2H3 cells were stimulated with DNP-HSA (100 ng/ml) for 1 h. Cell lysates were immunoprecipitated with the indicated antibody (2 μg/ml), followed by Western blot analysis. E, the IgE-sensitized BMMCs were stimulated with DNP-HSA (100 ng/ml) for various time intervals. Cell lysates prepared at each time point were subjected to Western blot analysis (left). IgE-sensitized BMMCs were stimulated with DNP-HSA (100 ng/ml) for 1 h. Cell lysates were then immunoprecipitated with the indicated antibody (2 μg/ml), followed by Western blot analysis (right). F, the IgE-sensitized RBL2H3 cells were stimulated with DNP-HSA (100 ng/ml) for 1 h. Immunofluorescence staining employing the indicated antibody was performed as described. G, RBL2H3 cells were transiently transfected with the indicated siRNA (10 nm each) prior to sensitization with DNP-specific IgE (100 ng/ml). The IgE-sensitized RBL2H3 cells were then stimulated with DNP-HSA (100 ng/ml) for 1 h. A histamine release assay and β-hexosaminidase activity assays employing cell lysates were performed as described. *, p < 0.05; **, p < 0.005; ***, p < 0.0005. Error bars, S.E.
FIGURE 2.
FIGURE 2.
TGaseII is necessary for TpCR. A, BALB/c mice were given an intravenous (i.v.) injection with DNP-specific IgE antibody (10 μg/kg) along with scrambled or TGaseII siRNA (each at 100 nm). The next day, both ears of mice were painted with DNFB or DMSO. At each time point after DNFB stimulation, ear thickness was measured. Each experimental group consisted of four BALB/c mice. Means ± S.E. (error bars) of three independent experiments are depicted. **, p < 0.005, compared with IgE/scrambled; ##, p < 0.005, compared with IgE/SiTGaseII/DNFB (1 h); ###, p < 0.0005, compared with IgE/SiTGaseII/DNFB (24 h). B, paraffin section of the ear tissue of the indicated BALB/c mouse was subjected to immunohistochemical staining employing anti-TGaseII or anti-c-Kit antibody. Representative images from four animals of each experimental group are shown (magnification, ×400; Olympus). H&E staining was also performed to determine the extent of leukocyte infiltration. C, ear tissue lysates prepared at the indicated time point were subjected to Western blot analysis (top). The same ear tissue lysates were immunoprecipitated (IP) with the indicated antibody (2 μg/ml), followed by Western blot analysis (bottom). Sc, SiScrambled. Ear tissue lysates were isolated from each mouse of each experimental group of mice.
FIGURE 3.
FIGURE 3.
TGaseII is necessary for PCA. A, BALB/c mice were given an intravenous (i.v.) injection of TNP-specific IgE (0.5 μg/kg). The next day, BALB/c mice were given an intradermal (i.d.) injection of scrambled (100 nm) or TGaseII siRNA (100 nm). One hour after the injection of the siRNA, the mice were challenged with PBS or TNP-BSA (250 μg/kg). Ear thickness was measured as described. −24 and −1, 24 and 1 h before the challenge with TNP-BSA. B, ear tissue lysates prepared at 1 h after stimulation with TNP-BSA were subjected to Western blot analysis (left). The same ear tissue lysates were immunoprecipitated with the indicated antibody (2 μg/ml), followed by Western blot analysis (right). C, BALB/c mice were given an intravenous injection of TNP-specific IgE (0.5 μg/kg). The next day, BALB/c mice were given an intradermal injection of scrambled (100 nm) or TGaseII siRNA (100 nm). One hour after the injection of the siRNA, BALB/c mice were given an intravenous injection of PBS or TNP-BSA (250 μg/kg) along with 2% (v/v) Evans blue solution. One hour after the injection of Evans blue solution, the dye was eluted from the ear in 700 μl of formamide at 63 °C. The absorbance was measured at 620 nm (middle). **, p < 0.005. A paraffin section of the ear tissue of the indicated experimental group of BALB/c mice was subjected to immunohistochemical staining employing anti-TGaseII antibody (bottom). Representative images from four animals of each experimental group are shown (magnification, ×400; Olympus). H&E staining was also performed (bottom). −24 and −1, 24 and 1 h before the challenge with TNP-BSA. D, BALB/c mice were given an intravenous injection of DNP-specific IgE (0.5 μg/kg). The next day, BALB/c mice were given an intradermal injection of scrambled (100 nm) or TGaseII siRNA (100 nm). One hour after the injection of siRNA, BALB/c mice were given an intravenous injection of PBS or DNP-HSA (250 μg/kg) along with 2% (v/v) Evans blue solution. One hour after the injection of Evans blue solution, the dye was eluted from the ear in 700 μl of formamide at 63 °C. The absorbance was measured at 620 nm (middle). **, p < 0.005. Ear tissue lysates were isolated from each mouse of each experimental group of mice and were immunoprecipitated with the indicated antibody (2 μg/ml), followed by Western blot analysis (bottom). Ear tissue lysate were also subjected to Western blot analysis (bottom). −24 and −1, 24 and 1 h before the challenge with DNP-HSA. Error bars, S.E.
FIGURE 4.
FIGURE 4.
TGaseII mediates enhanced metastatic potential of B16F1 melanoma cells by PSA. A, BALB/c mice were sensitized with DNP-specific IgE (0.5 μg/kg) by an intravenous (i.v.) injection. The next day, BALB/c mice were given an intravenous injection of DNP-HSA (250 μg/kg) along with scrambled (100 nm) or TGaseII siRNA (100 nm). Each mouse received an intravenous injection of B16F1 melanoma cells (2 × 10⁵) on day 5 of the time line. On day 14 of the time line, lung tissues were harvested. B, formalin-fixed lung sections were stained with H&E. Black arrows, lung metastatic foci (scale bar, 100 μm). The extent of lung metastasis was determined as described. **, p < 0.005. Each group consisted of four mice. C, imunonohistochemical staining of lung tumor tissue employing the indicated antibody was performed as described. Each group consisted of four mice. D, cryosections of lung tumor tissues were prepared, and immunofluorescence staining employing the indicated antibody was performed. DAPI staining was also performed for nuclear staining. E, lung tumor tissue lysates were isolated from each mouse of each experimental group of mice and were subjected to Western blot analysis (top). Lung tumor lysates were isolated from each mouse of each experimental group of mice and were immunoprecipitated (IP) with the indicated antibody (2 μg/ml), followed by Western blot analysis (bottom). Error bars, S.E.
FIGURE 5.
FIGURE 5.
Recombinant TGaseII protein enhances the metastatic potential of B16F1 melanoma cells and activates EGFR and FcϵRIβ. A, the conditioned medium of RBL2H3 cells stimulated with DNP-HSA (100 ng/ml) for 1 h was freeze-dried. The indicated amount of freeze-dried conditioned medium was subjected to Western blot analysis (top). RBL2H3 cells were treated with recombinant TGaseII (1 ng/ml) for various time intervals. Cell lysates prepared at each time point were subjected to Western blot analysis (bottom). RBL2H3 cells were treated with recombinant TGaseII (1 ng/ml) for 1 h. Cell lysates were immunoprecipitated (IP) with the indicated antibody (2 μg/ml), followed by Western blot analysis (bottom). B, RBL2H3 cells or BMMCs were treated with recombinant TGaseII protein (1 ng/ml) for 1 h. Histamine release assay and β-hexosaminidase activity assays were performed as described. *, p < 0.05; **, p < 0.005; ***, p < 0.005. C, BALB/c mice were given an intravenous injection of recombinant TGaseII protein (100 ng) or PBS. The next day, BALB/c mice were given an intravenous injection of B16F1 melanoma cells. On day of 14 of the time line, lung tumor tissues were harvested. Lung tumor tissue lysates were isolated from each mouse of each experimental group of mice and were subjected to Western blot analysis (left). Lung tumor tissue lysates were isolated from each mouse of each experimental group of mice and were immunoprecipitated with the indicated antibody (2 μg/ml), followed by Western blot analysis (right). D, the extent of lung metastasis was determined. Black arrows, lung metastatic foci (scale bar, 50 μm). Imunonohistochemical staining of lung tumor tissue employing the indicated antibody was performed as described (scale bar, 10 μm, right). ***, p < 0.0005. Representative images from four animals of each experimental group are shown. E, cryosections of lung tumor tissues were prepared, and immunofluorescence staining employing the indicated antibody was performed. F, RBL2H3 cells were treated with mouse recombinant TGaseII protein (1 ng/ml) for various time intervals. Cell lysates prepared at each time point were subjected to Western blot analysis (top). Cell lysates were also immunoprecipitated with the indicated antibody (2 μg/ml), followed by Western blot analysis (bottom). G, BALB/c mice were given an intravenous injection of mouse recombinant TGaseII protein (5 μg/kg) or PBS. One hour or 24 h after injection, BALB/c mice were given an intravenous injection of 2% (v/v) Evans blue solution. Representative images from four animals of each experimental group are shown. ***, p < 0.0005. H, BALB/c mice were given an intravenous injection of mouse recombinant TGaseII protein (5 μg/kg) or PBS. Five days after the injection of recombinant TGaseII protein, ears of BALB/c mice were excised and subjected to whole mount staining employing anti-PECAM-1 antibody. Representative images from four animals of each experimental group are shown (magnification, ×100; Olympus). Error bars, S.E.
FIGURE 6.
FIGURE 6.
EGFR is necessary for TGaseII-promoted allergic inflammation. A, RBL2H3 cells were pretreated with IgG (2 μg/ml) or CTX (0.5 μg/ml) for 30 min, followed by treatment with recombinant TGaseII protein (1 ng/ml) for 1 h. Cell lysates were subjected to Western blot (left) or immunoprecipitation employing the indicated antibody (right). B, same as A except that a β-hexosaminidase activity assay was performed. C, BALB/c mice were given an intradermal injection of recombinant TGaseII protein (5 μg/kg). The next day, BALB/c mice were given an intravenous injection of CTX (2 μg/kg). One hour after the injection of CTX, BALB/c mice were given an intravenous injection of 2% (v/v) Evans blue solution. One hour after the injection of Evans blue solution, the dye was eluted from the ear in 700 μl of formamide at 63 °C. The absorbance was measured at 620 nm (left). Two hours after the injection of CTX, ear tissue lysates were prepared and subjected to a β-hexosaminidase activity assay (right). D, ear tissue lysates isolated after the injection of CTX were subjected to Western blot analysis (left) or immunoprecipitation (right). Error bars, S.E.
FIGURE 7.
FIGURE 7.
miR-218 regulates the expression of TGaseII. A, RBL2H3 cells were transiently transfected with the indicated siRNA (10 nm each) prior to sensitization with DNP-specific IgE (100 ng/ml). The IgE-sensitized RBL2H3 cells were then stimulated with DNP-HSA (100 ng/ml) for 1 h. miRNA array analysis was performed as described. Below are shown miRNAs that are decreased by antigen stimulation in RBL2H3 cells. B, same as A except that qRT-PCR was performed to determine the expression level of miR-218. ***, p < 0.0005. C, the IgE-sensitized RBL2H3 cells were stimulated with DNP-HSA (100 ng/ml) for various time intervals. At each time point, the expression level of miR-218 was determined by qRT-PCR analysis. ***, p < 0.0005. ns, not significant. D, RBL2H3 cells were transiently transfected with control vector (1 μg) or miR-218 construct (1 μg) prior to sensitization with DNP-specific IgE (100 ng/ml). The IgE-sensitized RBL2H3 cells were then stimulated with DNP-HSA (100 ng/ml) for 1 h. Cell lysates prepared were subjected to Western blot analysis (left). The prepared cell lysates were immunoprecipitated with the indicated antibody (2 μg/ml), followed by Western blot analysis (middle). The prepared cell lysates were subjected to β-hexosaminidase activity assays (right). qRT-PCR analysis was performed to determine the expression level of miR-218 (right). **, p < 0.005; ***, p < 0.0005. E, promoter sequences of TGaseII (top). RBL2H3 cells were transiently transfected with the indicated siRNA (10 nm each) prior to sensitization with DNP-specific IgE (100 ng/ml). The IgE-sensitized RBL2H3 cells were then stimulated with DNP-HSA (100 ng/ml) for 1 h. ChIP assays employing the indicated antibody were performed as described. Numbers in parentheses denote primer binding sites. F, same as D except that immunofluorescence staining employing the indicated antibody was performed. Error bars, S.E.
FIGURE 8.
FIGURE 8.
The inhibition of miR-218 induces the features of allergic inflammation. A, RBL2H3 cells were transiently transfected with various concentrations of miR-218 inhibitor. At 24 h after transfection, the prepared cell lysates were subjected to Western blot analysis (left). RBL2H3 cells were transiently transfected with miR-218 inhibitor (100 nm). At 24 h after transfection, cell lysates were immunoprecipitated with the indicated antibody (2 μg/ml), followed by Western blot analysis (middle). The expression level of miR-218 at each time point was determined by qRT-PCR (right). *, p < 0.05. ns, not significant. B, various concentrations of miR-218 inhibitor were injected into ears of BALB/c mice. At each time point after the injection of miR-218 inhibitor, ear thickness was measured as described. C, ear tissue lysates isolated from each mouse of each experimental group of mice injected with miR-218 inhibitor at the indicated concentration were subjected to β-hexosaminidase activity assays. **, p < 0.005. ns, not significant. D, same as C except that Western blot analysis (left) or immunoprecipitation (right) was performed. E, same as C except that qRT-PCR analysis was performed. *, p < 0.05; **, p < 0.005; ***, p < 0.0005. Error bars, S.E.
FIGURE 9.
FIGURE 9.
miR-181a negatively regulates the in vitro allergic inflammation. A, the IgE-sensitized RBL2H3 cells were stimulated with DNP-HSA (100 ng/ml) for various time intervals. The expression level of miR-181a was determined by qRT-PCR. **, p < 0.005; ***p < 0.0005. B, RBL2H3 cells were transiently transfected with the indicated construct (1 μg) prior to sensitization with DNP-specific IgE (100 ng/ml). The IgE-sensitized RBL2H3 cells were then stimulated with DNP-HSA (100 ng/ml) for 1 h. The expression level of miR-181a was determined by qRT-PCR (left). Cell lysates were subjected to Western blot analysis (middle) or were immunoprecipitated with the indicated antibody (2 μg/ml), followed by Western blot analysis (right). ***, p < 0.0005. C, promoter sequences of miR-181a. RBL2H3 cells were transiently transfected with the indicated siRNA (10 nm each) prior to sensitization with DNP-specific IgE (100 ng/ml). The IgE-sensitized RBL2H3 cells were then stimulated with DNP-HSA (100 ng/ml) for 1 h, followed by ChIP assays employing the indicated antibody (2 μg/ml). Numbers in parentheses denote primer binding sites. D, RBL2H3 cells were transiently transfected with the indicated mimic (10 nm) prior to sensitization with DNP-specific IgE (100 ng/ml). The IgE-sensitized RBL2H3 cells were then stimulated with DNP-HSA (100 ng/ml) for 1 h. Immunofluorescence staining employing the indicated antibody was performed as described. E, same as D except that β-hexosaminidase activity assays and qRT-PCR analysis were performed. *, p < 0.05; ***, p < 0.0005. IP, immunoprecipitation. Error bars, S.E.
FIGURE 10.
FIGURE 10.
miR-218 and miR-181a target TGaseII. A, potential binding of miR-218 to the 3′-UTR of TGaseII (top). RBL2H3 cells were transiently transfected with control vector (1 μg) or miR-218 construct (1 μg) along with wild type 3′-UTR-luciferase construct (Wt) or mutant 3′-UTR-luciferase construct (Mt), prior to sensitization with DNP-specific IgE (100 ng/ml). The IgE-sensitized RBL2H3 cells were then stimulated with DNP-HSA (100 ng/ml) for 1 h. The luciferase activity assay was performed as described (bottom). *, p < 0.05. B, potential binding of miR-181a to the 3′-UTR of TGaseII (top). RBL2H3 cells were transiently transfected with control vector or miR-218 construct along with wild type 3′-UTR-luciferase construct or mutant 3′-UTR-luciferase construct prior to sensitization with DNP-specific IgE (100 ng/ml). The IgE-sensitized RBL2H3 cells were then stimulated with DNP-HSA (100 ng/ml) for 1 h. The luciferase activity assay was performed as described (bottom). **, p < 0.005; ***, p < 0.0005. Error bars, S.E.
FIGURE 11.
FIGURE 11.
miR-181a negatively regulates PSA. A, BALB/c mice were sensitized to DNP-specific IgE (0.5 μg/kg) by an intravenous injection. The next day, BALB/c mice were also given an intravenous injection of control mimic (100 nm) or miR-181a mimic (100 nm) along with DNP-HSA (250 μg/kg). Twenty-four hours after stimulation with DNP-HSA, a histamine release assay employing the sera of BALB/c mice was performed. *, p < 0.05; **, p < 0.005. B, same as A except that Western blot, immunoprecipitation, and β-hexosaminidase activity assays were performed by employing lung tissue obtained after PSA. ***, p < 0.0005. Lung tissue lysates were isolated from each mouse of each experimental group of mice. C, same as A except that the expression level of miR-181a was determined by quantitative real-time PCR employing lung tissue obtained after PSA. *, p < 0.05; ***, p < 0.005. D, same as B except that mast cells isolated from lung tissue were employed. ***, p < 0.005. E, same as A except that immunofluorescence staining employing cryosection of lung tissue obtained after PSA was performed. Error bars, S.E.
FIGURE 12.
FIGURE 12.
R2 peptide, an inhibitor of TGaseII, negatively regulates in vitro allergic inflammation. A, the IgE-sensitized RBL2H3 cells were pretreated with various concentrations of R2 peptide for 1 h, followed by stimulation with DNP-HSA (100 ng/ml) for 1 h. Cell lysates isolated were subjected to Western blot analysis (top). The IgE-sensitized RBL2H3 cells were pretreated with R2 peptide (5 μm), followed by stimulation with DNP-HSA (100 ng/ml) for 1 h. Cell lysates were subjected to Western blot analysis (middle) or immunoprecipitated (IP) with the indicated antibody (2 μg/ml) followed by Western blot analysis (bottom). B, the IgE-sensitized RBL2H3 cells were pretreated with R2 peptide (5 μm), followed by stimulation with TNP-BSA (100 ng/ml) for 1 h. Cell lysates were then subjected to Western blot analysis (top). Cell lysates were also immunoprecipitated with the indicated antibody (2 μg/ml), followed by Western blot analysis (bottom). C, the IgE-sensitized RBL2H3 cells were pretreated with R2 peptide (5 μm) for 1 h, followed by stimulation with DNP-HSA (100 ng/ml) for 1 h. Immunofluorescence staining employing the indicated antibodies (2 μg/ml) was performed. D, same as C except that a β-hexosaminidase activity assay and qRT-PCR analysis to determine the expression of miR-218 and miR-181a were performed. *, p < 0.05; **, p < 0.005; ***, p < 0.0005. Error bars, S.E.
FIGURE 13.
FIGURE 13.
R2 peptide negatively regulates PCA. A, BALB/c mice were given an intradermal injection of DNP-specific IgE antibody (0.5 μg/kg) or DNP-specific IgG (0.5 μg/kg). The next day, BALB/c mice were given an intravenous injection of PBS or DNP-HSA (250 μg/kg) and R2 peptide (9 mg/kg) along with 2% (v/v) Evans blue solution. One hour after the injection, the extent of vascular permeability was determined as described. Means ± S.E. of three independent experiments are depicted. *, p < 0.05. Each experimental group consisted of four mice. B, ear tissue lysates were isolated from each mouse of each experimental group of mice and were subjected to Western blot analysis, immunoprecipitation, and β-hexosaminidase activity assays. Ear tissue lysates were also subjected to qRT-PCR analysis to determine the expression of miR-181a and miR-218. **, p < 0.005; ***, p < 0.0005. C, BALB/c mice were given an intradermal injection of TNP-specific IgE (0.5 μg/kg) or DNP-specific IgG (0.5 μg/kg). The next day, BALB/c mice were given an intravenous injection of PBS or TNP-BSA (250 μg/kg) along with R2 peptide (9 mg/kg). The extent of vascular permeability was determined as described. **, p < 0.005. Each experimental group consisted of four mice. D, ear tissue lysates were isolated from each mouse of each experimental group of mice and were subjected to Western blot analysis, immunoprecipitation (IP), and β-hexosaminidase activity assays. Ear tissue lysates were also subjected to qRT-PCR analysis to determine the expression of miR-181a and miR-218. *, p < 0.05; **, p < 0.005; ***, p < 0.0005. Error bars, S.E.
FIGURE 14.
FIGURE 14.
R2 peptide negatively regulates PSA and angiogenesis associated with PSA. A, BALB/c mice were sensitized to DNP-specific IgE (0.5 μg/kg) by an intravenous injection (i.v.) into the tail vein. The next day, BALB/c mice were given an intravenous injection of DNP-HSA (250 μg/kg) along with R2 peptide (9 mg/kg). One hour after stimulation with DNP-HSA (250 μg/kg), lung tissues were isolated. B, lung tissue lysates were isolated from each mouse of each experimental group of mice and were subjected to Western blot analysis (left) or immunoprecipitated with the indicated antibody (2 μg/ml), followed by Western blot analysis (right). C, lung tissue lysates were subjected to β-hexosaminidase activity assays. Lung tissue lysates isolated were also subjected to qRT-PCR analysis to determine the expression level of miR-218 or miR-181a. *, p < 0.05; **, p < 0.005; ***, p < 0.0005. D, immunofluorescence staining employing cryosection of lung tissue was performed as described. E, the conditioned medium of lung mast cells obtained after PSA was mixed with Matrigel. Intravital microscopy was performed as described. ***, p < 0.0005. Western blot of lung mast cells obtained after PSA was also performed. Error bars, S.E.
FIGURE 15.
FIGURE 15.
Mast cells activate macrophages during allergic inflammation in a TGaseII-dependent manner. A, BALB/c mouse model of PSA was performed as described. Lung mast cell and lung macrophages were isolated as described. The conditioned medium of lung mast cells was prepared and added to lung macrophages in serum-free medium in a 1:1 ratio. Twenty-four hours after the addition of the conditioned medium, immunofluorescence staining employing the indicated antibody was performed. C.M., conditioned medium. B, same as A except that qRT-PCR and Western blot analysis were performed. *, p < 0.05; **, p < 0.005. Error bars, S.E.
FIGURE 16.
FIGURE 16.
Mast cells and tumor cells form a positive feedback loop. A, conditioned medium (C.M.) of lung mast cells after PSA was prepared and added to B16F1 melanoma cells in serum-free medium in a 1:1 ratio. Movement of cells into the wound was shown for the indicated cancer cell line at 0 and 48 h postscratch (magnification, ×40). Data were the means of three independent experiments. Error bars, S.D. Broken lines, boundary lines of scratch. The conditioned medium of lung mast cells was prepared and added to lung macrophages in serum-free medium in a 1:1 ratio. Twenty-four hours after the addition of the conditioned medium, cell lysates were prepared and subjected to Western blot analysis (right). **, p < 0.005; ***, p < 0.0005. B, B16F1 cells were transfected with the indicated inhibitor (50 nm each). At 48 h after transfection, qRT-PCR analysis and Western blot analysis were performed. C, conditioned medium of B16F1 cells obtained after transfection with the indicated inhibitor was added to lung mast cells. At 24 h after the addition of the conditioned medium, a β-hexosaminidase activity assay, qRT-PCR analysis, Western blot analysis, and immunoprecipitation were performed.
FIGURE 17.
FIGURE 17.
Macrophages activate mast cells, are necessary for angiogenesis associated with PSA, and enhance the migration potential of B16F1 melanoma cells. A, BALB/c mouse model of PSA was performed as described. Lysates isolated from lung macrophages after PSA were subjected to Western blot analysis (top). Flow cytometry analysis employing anti-CD163 antibody was performed as described (bottom). B, the conditioned medium of lung macrophages isolated after PSA was prepared and added to lung mast cells in serum-free medium in a 1:1 ratio. Twenty-four hours after the addition of the conditioned medium, Western blot analysis (top) and immunoprecipitation (IP) (bottom) were performed. C, same as B except that that the β-hexosaminidase activity assay and qRT-PCR were performed. *, p < 0.05. D, the conditioned medium of lung macrophages obtained after PSA was mixed with Matrigel. Intravital microscopy was performed as described. ***, p < 0.0005. E, the conditioned medium of lung macrophages isolated after PSA was prepared and added to B16F1 melanoma cells in serum-free medium in a 1:1 ratio. Movement of cells into the wound was shown for the indicated cancer cell line at 0 and 48 h postscratch (magnification, ×40). Data are the means of three independent experiments. Error bars, S.D. Broken lines, boundary lines of scratch. **, p < 0.005. The conditioned medium of lung macrophages was prepared and added to lung macrophages in serum-free medium in a 1:1 ratio. At 24 h after the addition of the conditioned medium, cell lysates were prepared and subjected to Western blot analysis.
FIGURE 18.
FIGURE 18.
Macrophages form a positive feedback loop with tumor cells. A, the conditioned medium (C.M.) of B16F1 cells obtained after miR-218 inhibitor transfection was added to lung macrophages in serum-free medium in a 1:1 ratio. At 24 h after the addition of the conditioned medium, cell lysates were subjected to Western blot analysis (left). qRT-PCR analysis to determine the expression of miR-218 and miR-181a was also performed (right). B, at 24 h after the addition of the conditioned medium, immunofluorescence staining was performed. Error bars, S.E.

Similar articles

Cited by

References

    1. Lorand L., Weissmann L. B., Epel D. L., Bruner-Lorand J. (1976) Role of the intrinsic transglutaminase in the Ca2+-mediated crosslinking of erythrocyte proteins. Proc. Natl. Acad. Sci. U.S.A. 73, 4479–4481 - PMC - PubMed
    1. Fesus L., Szucs E. F., Barrett K. E., Metcalfe D. D., Folk J. E. (1985) Activation of transglutaminase and production of protein-bound γ-glutamylhistamine in stimulated mouse mast cells. J. Biol. Chem. 260, 13771–13778 - PubMed
    1. Palosuo K., Varjonen E., Nurkkala J., Kalkkinen N., Harvima R., Reunala T., Alenius H. (2003) Transglutaminase-mediated cross-linking of a peptic fraction of ω-5 gliadin enhances IgE reactivity in wheat-dependent, exercise-induced anaphylaxis. J. Allergy Clin. Immunol. 111, 1386–1392 - PubMed
    1. Lai T. S., Greenberg C. S. (2013) Histaminylation of fibrinogen by tissue transglutaminase-2 (TGM-2): potential role in modulating inflammation. Amino Acids 45, 857–864 - PubMed
    1. Molberg O., Mcadam S. N., Körner R., Quarsten H., Kristiansen C., Madsen L., Fugger L., Scott H., Norén O., Roepstorff P., Lundin K. E., Sjöström H., Sollid L. M. (1998) Tissue transglutaminase selectively modifies gliadin peptides that are recognized by gut-derived T cells in celiac disease. Nat. Med. 4, 713–717 - PubMed

Publication types

MeSH terms