

Role of connexin channels in the retinal light response of a diurnal rodent
- PMID: 25202238
- PMCID: PMC4142540
- DOI: 10.3389/fncel.2014.00249
Role of connexin channels in the retinal light response of a diurnal rodent
Abstract
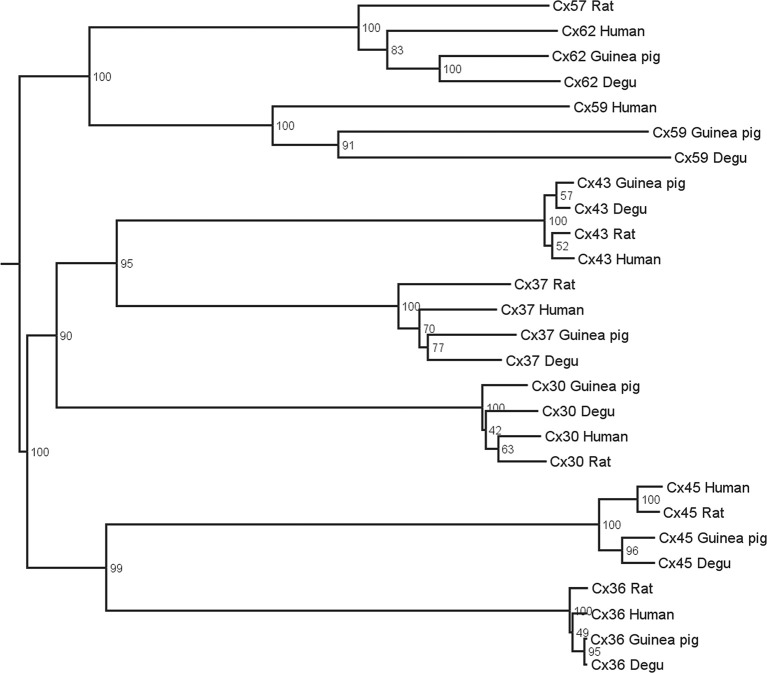
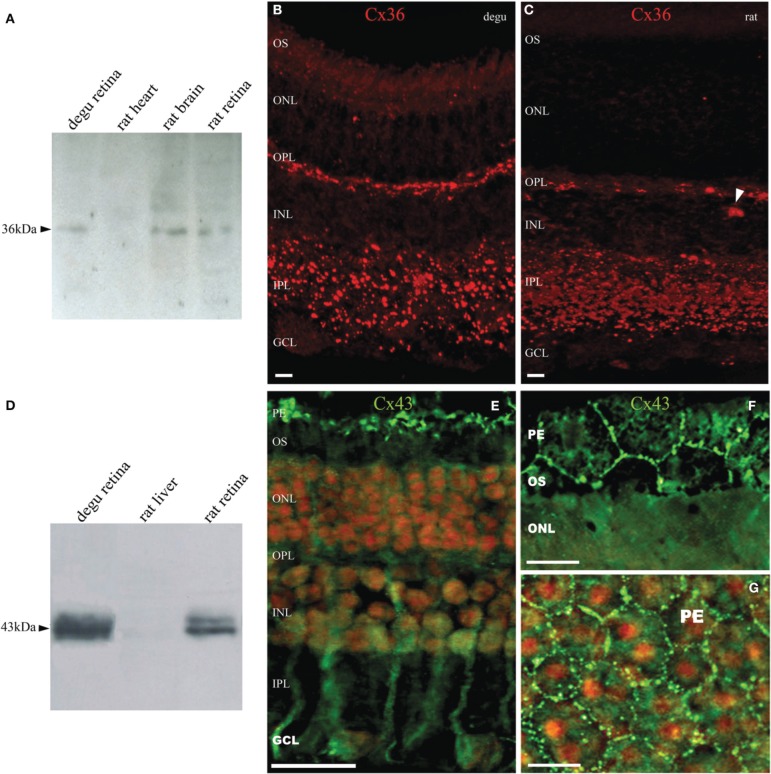
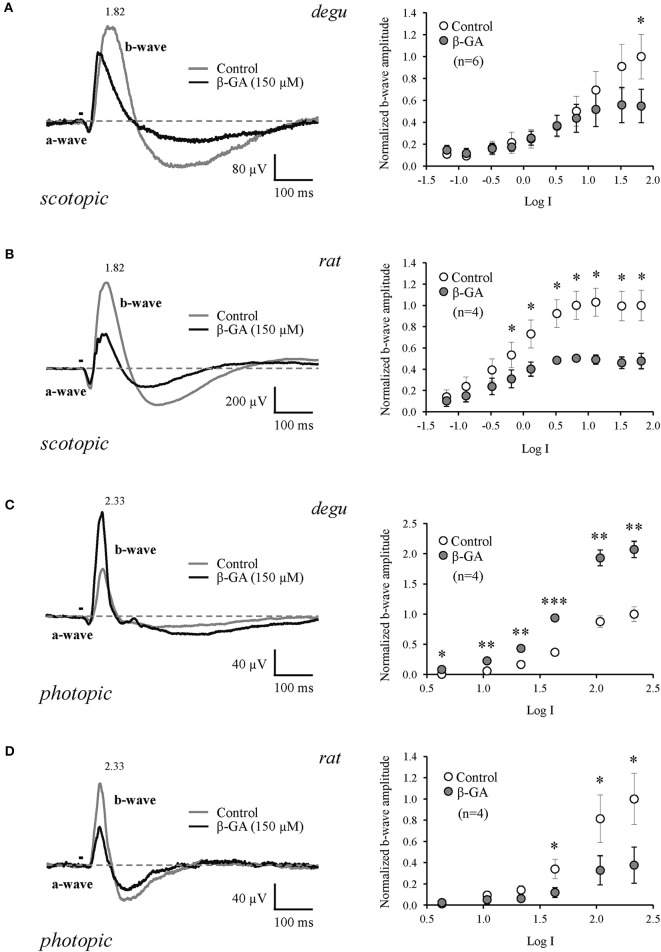
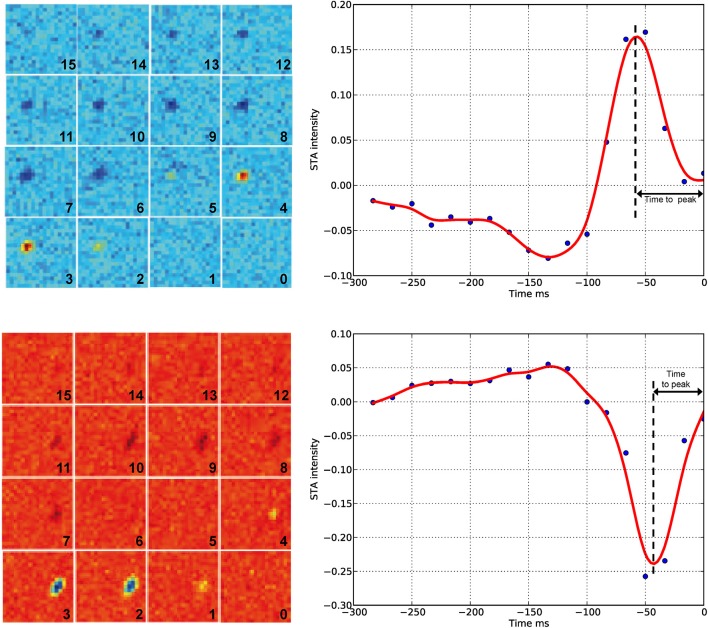
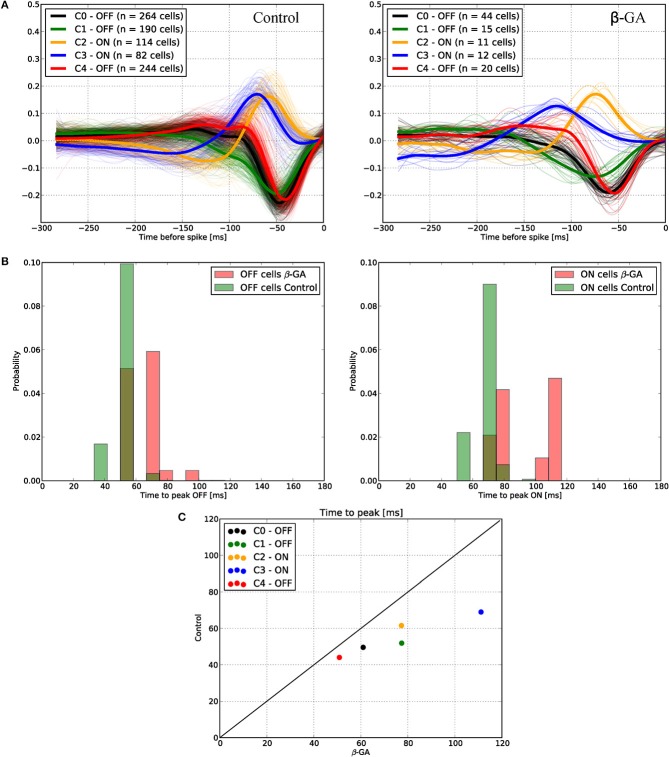
Several studies have shown that connexin channels play an important role in retinal neural coding in nocturnal rodents. However, the contribution of these channels to signal processing in the retina of diurnal rodents remains unclear. To gain insight into this problem, we studied connexin expression and the contribution of connexin channels to the retinal light response in the diurnal rodent Octodon degus (degu) compared to rat, using in vivo ERG recording under scotopic and photopic light adaptation. Analysis of the degu genome showed that the common retinal connexins present a high degree of homology to orthologs expressed in other mammals, and expression of Cx36 and Cx43 was confirmed in degu retina. Cx36 localized mainly to the outer and inner plexiform layers (IPLs), while Cx43 was expressed mostly in cells of the retinal pigment epithelium. Under scotopic conditions, the b-wave response amplitude was strongly reduced by 18-β-glycyrrhetinic acid (β-GA) (-45.1% in degu, compared to -52.2% in rat), suggesting that connexins are modulating this response. Remarkably, under photopic adaptation, β-GA increased the ERG b-wave amplitude in degu (+107.2%) while reducing it in rat (-62.3%). Moreover, β-GA diminished the spontaneous action potential firing rate in ganglion cells (GCs) and increased the response latency of ON and OFF GCs. Our results support the notion that connexins exert a fine-tuning control of the retinal light response and have an important role in retinal neural coding.
Keywords: connexins; multi-electrode array (MEA); neural coding; physiology; retina.
Figures
Similar articles
-
Effects of Cone Connexin-36 Disruption on Light Adaptation and Circadian Regulation of the Photopic ERG.Invest Ophthalmol Vis Sci. 2020 Jun 3;61(6):24. doi: 10.1167/iovs.61.6.24. Invest Ophthalmol Vis Sci. 2020. PMID: 32531058 Free PMC article.
-
Period gene expression in the diurnal degu (Octodon degus) differs from the nocturnal laboratory rat (Rattus norvegicus).Am J Physiol Regul Integr Comp Physiol. 2009 Feb;296(2):R353-61. doi: 10.1152/ajpregu.90392.2008. Epub 2008 Nov 26. Am J Physiol Regul Integr Comp Physiol. 2009. PMID: 19036829 Free PMC article.
-
The Role of Retinal Connexins Cx36 and Horizontal Cell Coupling in Emmetropization in Guinea Pigs.Invest Ophthalmol Vis Sci. 2021 Jul 1;62(9):27. doi: 10.1167/iovs.62.9.27. Invest Ophthalmol Vis Sci. 2021. PMID: 34283211 Free PMC article.
-
Connexin expression in the retina.Brain Res Brain Res Rev. 2000 Apr;32(1):138-45. doi: 10.1016/s0165-0173(99)00074-0. Brain Res Brain Res Rev. 2000. PMID: 10751663 Review.
-
Diurnal rodents as pertinent animal models of human retinal physiology and pathology.Prog Retin Eye Res. 2020 Jan;74:100776. doi: 10.1016/j.preteyeres.2019.100776. Epub 2019 Sep 6. Prog Retin Eye Res. 2020. PMID: 31499165 Review.
Cited by
-
Speed-Selectivity in Retinal Ganglion Cells is Sharpened by Broad Spatial Frequency, Naturalistic Stimuli.Sci Rep. 2019 Jan 24;9(1):456. doi: 10.1038/s41598-018-36861-8. Sci Rep. 2019. PMID: 30679564 Free PMC article.
-
An Update on Connexin Gap Junction and Hemichannels in Diabetic Retinopathy.Int J Mol Sci. 2021 Mar 21;22(6):3194. doi: 10.3390/ijms22063194. Int J Mol Sci. 2021. PMID: 33801118 Free PMC article. Review.
-
Retinal aging in the diurnal Chilean rodent (Octodon degus): histological, ultrastructural and neurochemical alterations of the vertical information processing pathway.Front Cell Neurosci. 2015 Apr 21;9:126. doi: 10.3389/fncel.2015.00126. eCollection 2015. Front Cell Neurosci. 2015. PMID: 25954153 Free PMC article.
-
Loss of Gap Junction Delta-2 (GJD2) gene orthologs leads to refractive error in zebrafish.Commun Biol. 2021 Jun 3;4(1):676. doi: 10.1038/s42003-021-02185-z. Commun Biol. 2021. PMID: 34083742 Free PMC article.
-
Revisiting rodent models: Octodon degus as Alzheimer's disease model?Acta Neuropathol Commun. 2016 Aug 26;4(1):91. doi: 10.1186/s40478-016-0363-y. Acta Neuropathol Commun. 2016. PMID: 27566602 Free PMC article.
References
-
- Al-Ubaidi M. R., White T. W., Ripps H., Poras I., Avner P., Gomes D., et al. (2000). Functional properties, developmental regulation, and chromosomal localization of murine connexin36, a gap-junctional protein expressed preferentially in retina and brain. J. Neurosci. Res. 59, 813–826 10.1002/(SICI)1097-4547(20000315)59:6<3C813::AID-JNR14>3E3.0.CO;2-# - DOI - PubMed
LinkOut - more resources
Full Text Sources
Other Literature Sources
Miscellaneous