. 2014 Aug 22:8:285.
doi: 10.3389/fnbeh.2014.00285. eCollection 2014.

Gender-dependent resiliency to stressful and metabolic challenges following prenatal exposure to high-fat diet in the p66(Shc-/-) mouse

Affiliations

Gender-dependent resiliency to stressful and metabolic challenges following prenatal exposure to high-fat diet in the p66(Shc-/-) mouse

Veronica Bellisario et al. Front Behav Neurosci. .

Abstract

Metabolic stressful challenges during susceptible time windows, such as fetal life, can have important implications for health throughout life. Deletion of the p66(Shc) gene in mice leads to reduced oxidative stress (OS), resulting in a healthy and lean phenotype characterized by increased metabolic rate, resistance to high-fat diet (HFD)-induced obesity and reduced emotionality at adulthood. Here we hypothesize that p66(Shc-/-) (KO) adult offspring might be protected from the detrimental effects induced by maternal HFD administered before and during pregnancy. To test such hypothesis, we fed p66(Shc+/+) (WT) and KO females with HFD for 13 weeks starting on 5 weeks of age until delivery and tested adult male and female offspring for their metabolic, neuroendocrine, and emotional profile. Prenatal diet affected stress responses and metabolic features in a gender-dependent fashion. In particular, prenatal HFD increased plasma leptin levels and decreased anxiety-like behavior in females, while increasing body weight, particularly in KO subjects. KO mice were overall characterized by metabolic resiliency, showing a blunted change in glycemia levels in response to glucose or insulin challenges. However, in p66(Shc-/-) mice, prenatal HFD affected glucose tolerance response in an opposite manner in the two genders, overriding the resilience in males and exacerbating it in females. Finally, KO females were protected from the disrupting effect of prenatal HFD on neuroendocrine response. These findings indicate that prenatal HFD alters the emotional profile and metabolic functionality of the adult individual in a gender-dependent fashion and suggest that exposure to high-caloric food during fetal life is a stressful condition interfering with the developmental programming of the adult phenotype. Deletion of the p66(Shc) gene attenuates such effects, acting as a protective factor.

Keywords: adipokines; animal models; biomarkers; emotionality; gender; maternal obesity; oxidative stress; p66Shc gene.


Figures

Figure 1
Figure 1
Schematic design of the experimental plan.
Figure 2
Figure 2
Effect of high-fat feeding on dams. Food consumption (A) and body weight (B) of dams feed HFD. Data are shown as +s.e.m. Post-hoc comparisons, **p < 0.01 (hfd vs. cd). Experimental subjects, cd-wt/ko, n = 37/34; hfd-wt/ko, n = 40/37.
Figure 3
Figure 3
Body weight of the offspring after birth, P3 (A), at weaning, P30 (B), and at 3 months of age, P90 (C). Data are shown as +s.e.m. Post-hoc comparisons, *p < 0.05 (P3 and P90: hfd-ko vs. cd-ko); $p < 0.01 (P30: cd-ko vs. cd-wt); **p < 0.01 (P30: hfd-ko vs. cd-ko). Experimental subjects, P3: cd-wt, n = 16; cd-ko, n = 15; hfd-wt, n = 15; hfd-ko, n = 20; P30 and P90: cd-wt-f/m n = 15/10; cd-ko-f/m n = 9/14; hfd-wt-f/m n = 11/9; hfd-ko-f/m n = 11/14.
Figure 4
Figure 4
Body mass index. Data are shown +s.e.m. Post-hoc comparisons, *p < 0.05 (hfd-f vs. cd-f). Experimental subjects, cd-wt-f/m n = 8/9; cd-ko-f/m n = 8/9; hfd-wt-f/m n = 8/9; hfd-ko-f/m n = 7/10.
Figure 5
Figure 5
Onset of puberty. Correlation between offspring's body weight and timing of puberty in male and female HFD (A) and CD (B) offspring. Experimental subjects: cd-wt-f/m, n = 15/10; cd-ko-f/m, n = 10/11 hfd-wt-f/m, n = 10; hfd-ko-f/m, n = 11/14.
Figure 6
Figure 6
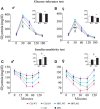
Metabolic regulation. Glucose tolerance assessment in WT and KO male (A) and female (B) offspring fed CD or HFD. Insulin sensitivity test in WT and KO male (C) and female (D) offspring fed CD or HFD. Data are shown as ±s.e.m. Post-hoc comparisons, $p < 0.05 (cd vs. hfd); *p < 0.05 (ko vs. wt); **p < 0.01. Experimental subjects: cd-wt-f/m, n = 17/22; cd-ko-f/m, n = 18/19; hfd-wt-f/m, n = 18/22; hfd-ko-f/m, n = 17/18.
Figure 7
Figure 7
Metabolic hormones. Plasma levels of adiponectin (A) and leptin (B) in male and female mice prenatally exposed to CD or HFD. Data are shown as +s.e.m. Post-hoc comparisons, *p < 0.05 (adiponectin: cd-ko-f vs. cd-wt-f and cd-ko-m; leptin: hfd-f vs. hfd-m). Experimental subjects, adiponectin assessment: cd-wt-f/m, n = 9; cd-ko-f/m, n = 8/9; hfd-wt-f/m, n = 8/9; hfd-ko-f/m, n = 8/10; leptin assessment: cd-wt-f/m, n = 7/9; cd-ko-f/m, n = 8/7; hfd-wt-f/m, n = 5/7; hfd-ko-f/m, n = 7/8.
Figure 8
Figure 8
Neuroendocrine activation. Neuroendocrine activation in female mice in response to an acute restraint stress (A) and feedback response of the HPA axis activation (B). Data are shown as +s.e.m. Post-hoc comparisons, *p < 0.05 (hfd-wt vs. hfd-ko and wt-cd, at 180 min; hfd-ko vs. hfd-wt, at 240 min); **p < 0.01 (hfd-wt vs. cd-wt and hfd-ko). Experimental subjects: cd-wt, n = 10; cd-ko, n = 8; hfd-wt/ko, n = 9.
Figure 9
Figure 9
Behavioral phenotype. Duration of locomotor activity in the Open Field test (A). Feminization of males' emotional profile prenatally exposed to HFD measured by the duration of grooming (B) and immobility (C) in the Elevated Plus Maze test. Data are shown as +s.e.m. Post-hoc comparisons, *p < 0.05 (OF: hfd 0–5 vs. 5–10); **p < 0.01 (hfd vs. cd at 5–10 and 10–15 min); *p < 0.05 (EPM: hfd-f vs. cd-f; hfd-m vs. cd-m). Experimental subjects, n = 12.

Similar articles

Cited by

References

    1. Akamine E. H., Marcal A. C., Camporez J. P., Hoshida M. S., Caperuto L. C., Bevilacqua E., et al. (2010). Obesity induced by high-fat diet promotes insulin resistance in the ovary. J. Endocrinol. 206, 65–74 10.1677/JOE-09-0461 - DOI - PubMed
    1. Antoniades C., Antonopoulos A. S., Tousoulis D., Stefanadis C. (2009). Adiponectin: from obesity to cardiovascular disease. Obes. Rev. 10, 269–279 10.1111/j.1467-789X.2009.00571.x - DOI - PubMed
    1. Azooz O. G., Farthing M. J., Savage M. O., Ballinger A. B. (2001). Delayed puberty and response to testosterone in a rat model of colitis. Am. J. Physiol. Regul. Integr. Comp. Physiol. 281, R1483–R1491 - PubMed
    1. Barker D. J. (1995). Intrauterine programming of adult disease. Mol. Med. Today 1, 418–423 10.1016/S1357-4310(95)90793-9 - DOI - PubMed
    1. Barker D. J. (2003). The developmental origins of adult disease. Eur. J. Epidemiol. 18, 733–736 10.1023/A:1025388901248 - DOI - PubMed