Review
. 2014 Aug 25:8:653.
doi: 10.3389/fnhum.2014.00653. eCollection 2014.

A review of structural neuroimaging in schizophrenia: from connectivity to connectomics

Affiliations
Review

A review of structural neuroimaging in schizophrenia: from connectivity to connectomics

Anne L Wheeler et al. Front Hum Neurosci. .

Abstract

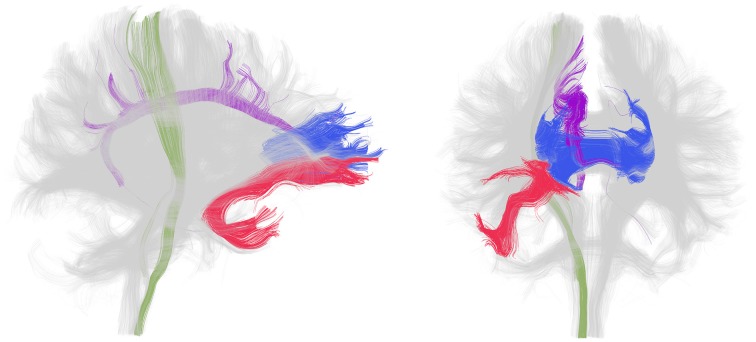
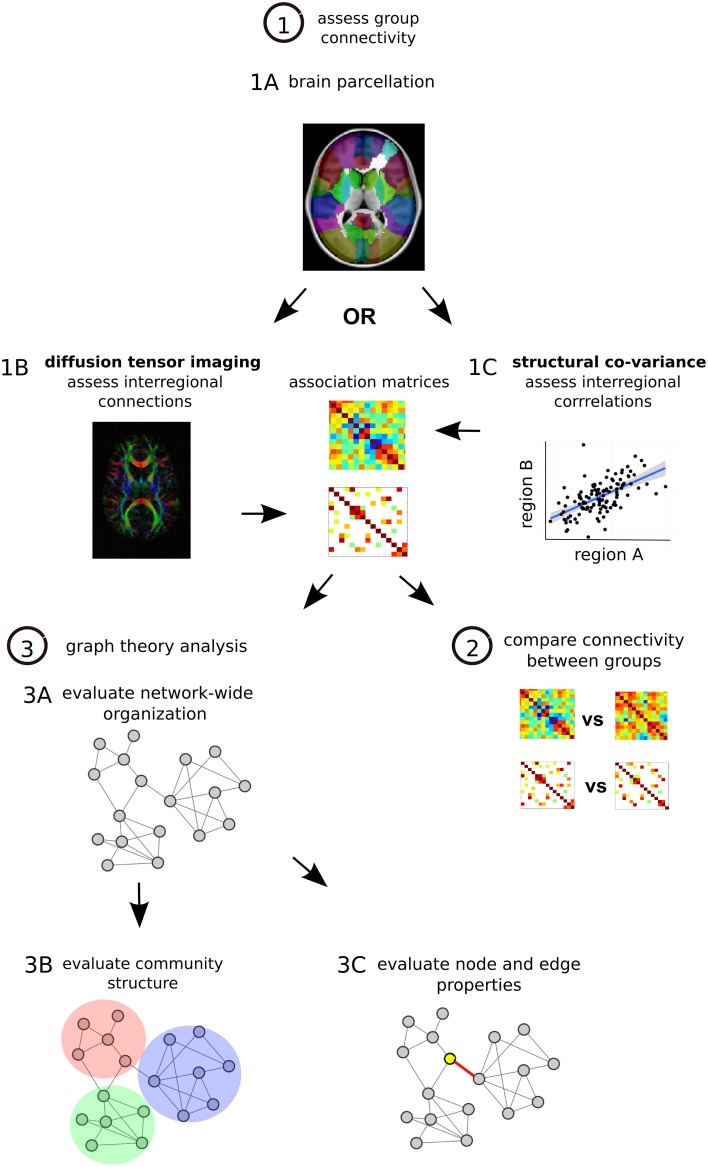
In patients with schizophrenia neuroimaging studies have revealed global differences with some brain regions showing focal abnormalities. Examining neurocircuitry, diffusion-weighted imaging studies have identified altered structural integrity of white matter in frontal and temporal brain regions and tracts such as the cingulum bundles, uncinate fasciculi, internal capsules and corpus callosum associated with the illness. Furthermore, structural co-variance analyses have revealed altered structural relationships among regional morphology in the thalamus, frontal, temporal and parietal cortices in schizophrenia patients. The distributed nature of these abnormalities in schizophrenia suggests that multiple brain circuits are impaired, a neural feature that may be better addressed with network level analyses. However, even with the advent of these newer analyses, a large amount of variability in findings remains, likely partially due to the considerable heterogeneity present in this disorder.

Keywords: connectivity; connectomics; diffusion tensor imaging; magnetic resonance imaging; schizophrenia; white matter.


Figures

Figure 1
Figure 1
White matter tracts most frequently identified as disrupted in patients with chronic schizophrenia. Lateral (left) and frontal (right) view of whole brain tractography as identified with a clustering method (Voineskos et al., 2009) and visualized in the 3D Slicer program in a sample subject. The uncinate fasciculus (red), cingulum bundle (purple), corpus callosum (blue, only the genu is shown) and internal capsule (green, only a portion spanning from the corticospinal tract is shown) are displayed in color and the rest of the tracts are gray. Note that disruption in these tracts has been shown bilaterally but association and projection tracts are only colored in the right hemisphere for clarity.
Figure 2
Figure 2
Structural network analysis steps. (1) Assess group connectivity. Perform MRI imaging and parcellate the brain, many different methods can be applied (Craddock et al., 2013) (1A). Quantify DTI-based structural connectivity or morphometry-based structural co-variance throughout the brain. For DTI the presence and strength of interregional connections are assessed, one matrix is generated for each subject and then a group average is calculated (1B). For structural co-variance analysis between-subject correlations in morphology are calculated in each group (1C). In each case associations are described with an association matrix whose rows and columns correspond to different brain regions. (2) Compare connectivity between groups. Statistical comparison can be done on a connection by connection basis with permutation testing or with Network Based Statistics (NBS), a statistical approach that is able to identify altered sub-networks while controlling the family wise error rate associated with testing for differences between a large number of connections (Zalesky et al., 2010). (3) Graph theory analysis. Convert matrices to networks with collections of nodes (brain regions) interconnected by edges (connections) (Bullmore and Sporns, 2009). Edges describe the degree of anatomical connectivity or coupling between network nodes and can be either weighted according to the strength of measured connectivity or unweighted and binary. Once networks are established, three basic types of graph theory measures can be assessed. First graph theory metrics can assess network-wide integration (characteristic path length, global efficiency) and segregation (mean clustering coefficient, mean local efficiency) as well as characterize network architecture (mean degree, degree distribution, mean connectivity, assortativity, hierarchy, small-world organization) (3A). Second, networks can be assessed for their modular structure, identifying distinct communities of nodes and connections that cluster together (3B). Third, at the level of individual regions and connections, nodes and edges can be assessed for centrality, which is thought to reflect the potential for enabling efficient communication in the network. These centrality measures are based on number of connections (degree) and positioning within the network (betweenness, eigenvector centrality, closeness). Hub regions in the brain that are thought to play more integral roles in network function due to their central positioning can be described with these centrality metrics (Rubinov and Bullmore, 2013) (3C).

References

    1. Abbs B., Liang L., Makris N., Tsuang M., Seidman L. J., Goldstein J. M. (2011). Covariance modeling of MRI brain volumes in memory circuitry in schizophrenia: sex differences are critical. Neuroimage 56, 1865–1874 10.1016/j.neuroimage.2011.03.079 - DOI - PMC - PubMed
    1. Abdul-Rahman M. F., Qiu A., Sim K. (2011). Regionally specific white matter disruptions of fornix and cingulum in schizophrenia. PLoS ONE 6:e18652 10.1371/journal.pone.0018652 - DOI - PMC - PubMed
    1. Alexander-Bloch A., Giedd J. N., Bullmore E. (2013). Imaging structural co-variance between human brain regions. Nat. Rev. Neurosci. 14, 322–336 10.1038/nrn3465 - DOI - PMC - PubMed
    1. Bassett D. S., Bullmore E., Verchinski B. A., Mattay V. S., Weinberger D. R., Meyer-Lindenberg A. (2008). Hierarchical organization of human cortical networks in health and schizophrenia. J. Neurosci. 28, 9239–9248 10.1523/JNEUROSCI.1929-08.2008 - DOI - PMC - PubMed
    1. Bhojraj T. S., Prasad K. M., Eack S. M., Francis A. N., Montrose D. M., Keshavan M. S. (2010). Do inter-regional gray-matter volumetric correlations reflect altered functional connectivity in high-risk offspring of schizophrenia patients? Schizophr. Res. 118, 62–68 10.1016/j.schres.2010.01.019 - DOI - PMC - PubMed

LinkOut - more resources