. 2014 Aug 8:6:33.
doi: 10.1186/2052-1847-6-33. eCollection 2014.

Cutaneous stimulation of discrete regions of the sole during locomotion produces "sensory steering" of the foot

Affiliations

Cutaneous stimulation of discrete regions of the sole during locomotion produces "sensory steering" of the foot

E Paul Zehr et al. BMC Sports Sci Med Rehabil. .

Abstract

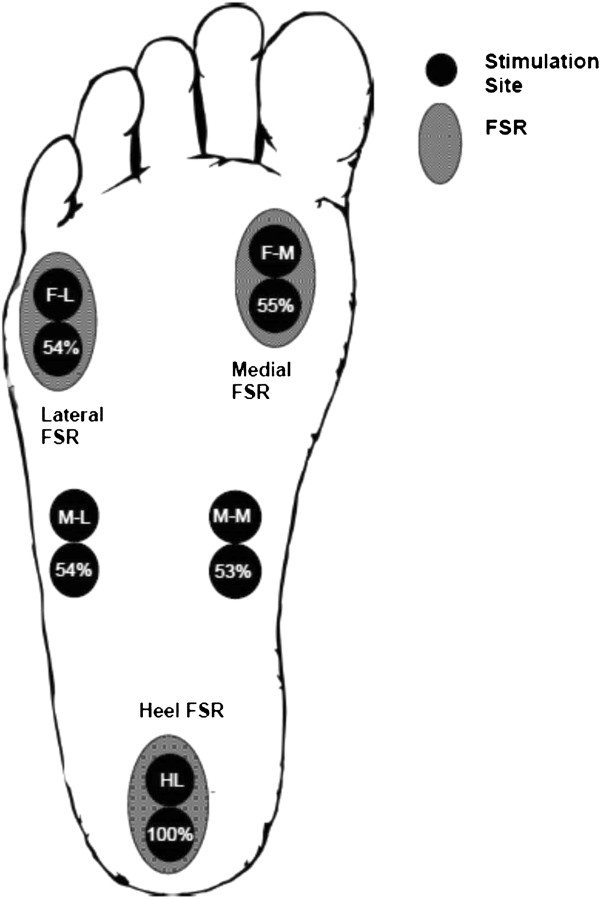
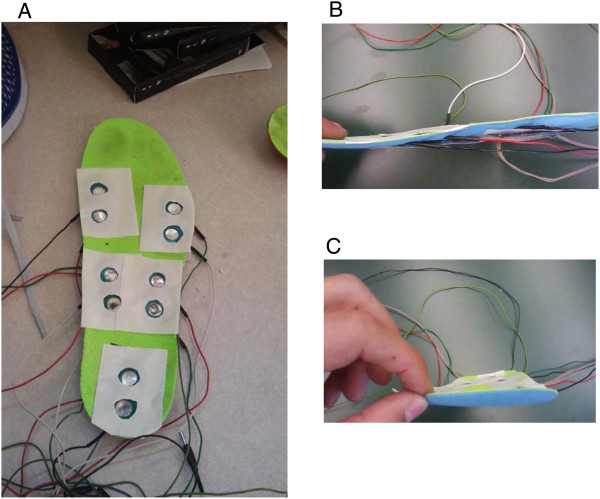
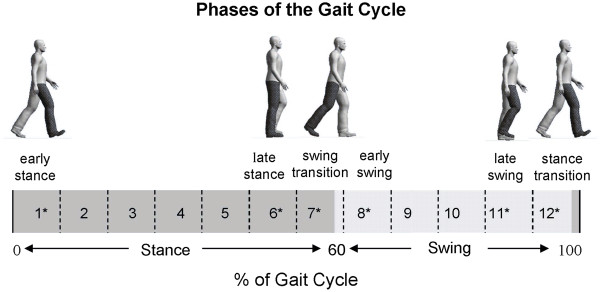
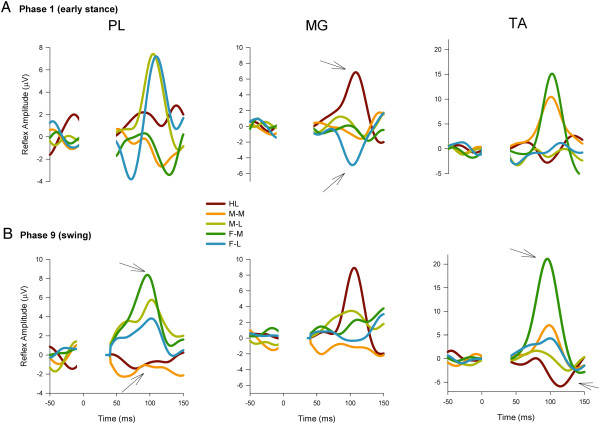
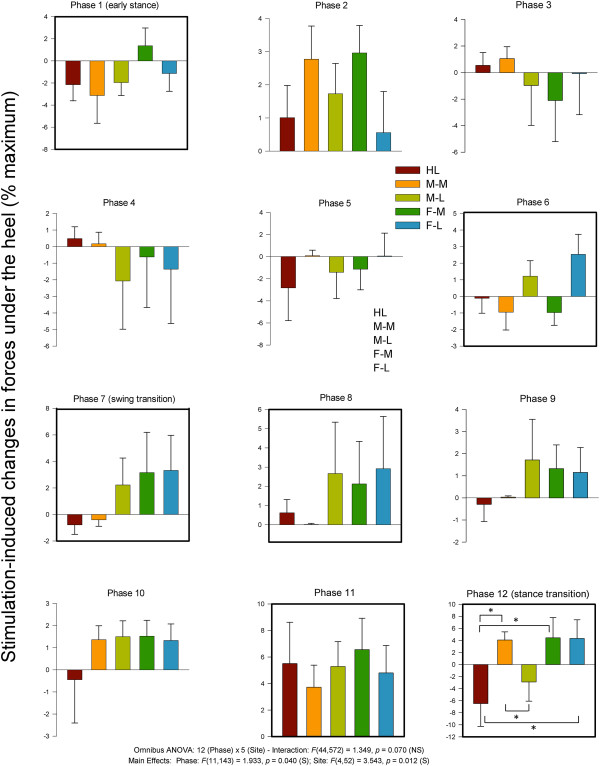
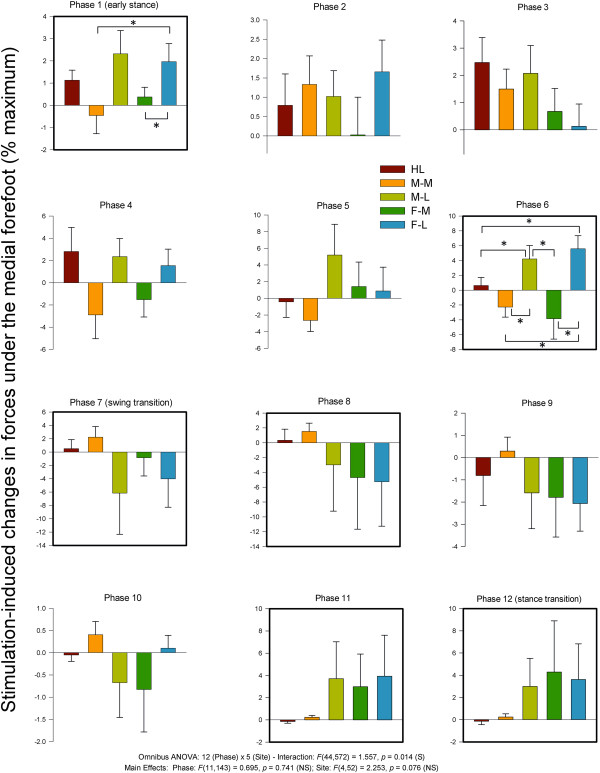
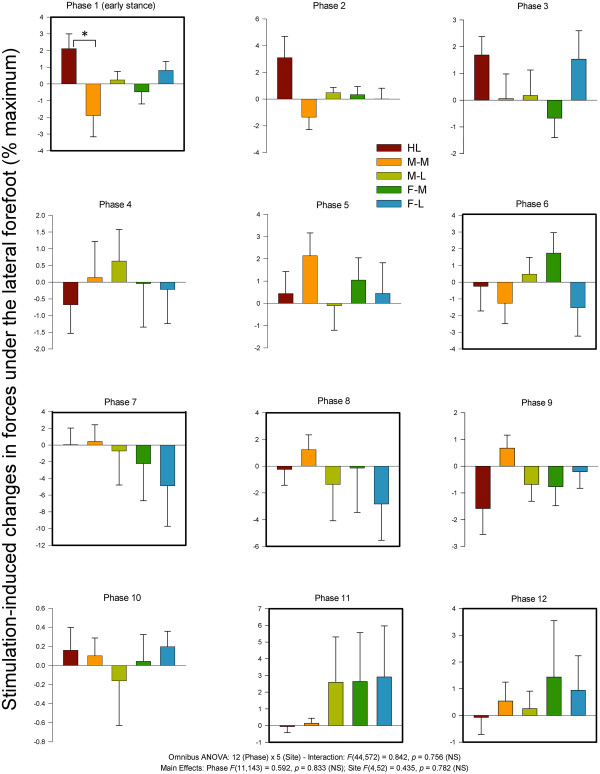
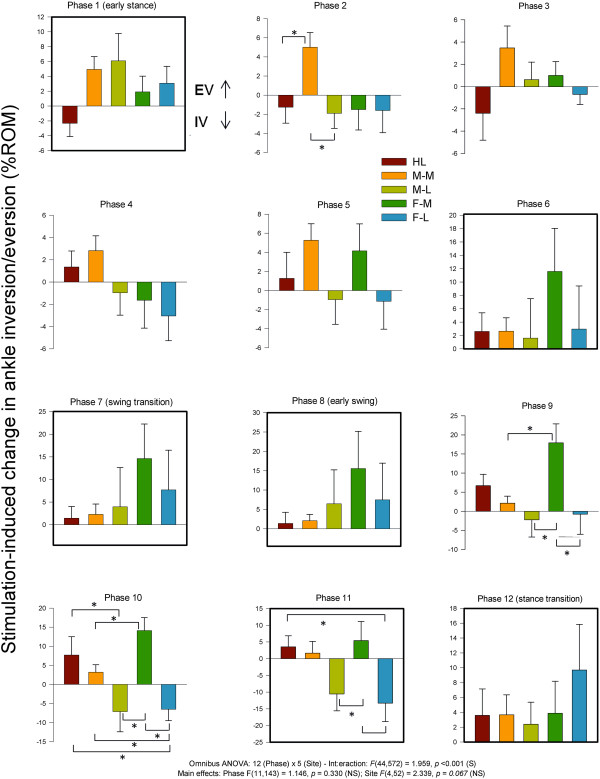
Background: While the neural and mechanical effects of whole nerve cutaneous stimulation on human locomotion have been previously studied, there is less information about effects evoked by activation of discrete skin regions on the sole of the foot. Electrical stimulation of discrete foot regions evokes position-modulated patterns of cutaneous reflexes in muscles acting at the ankle during standing but data during walking are lacking. Here, non-noxious electrical stimulation was delivered to five discrete locations on the sole of the foot (heel, and medial and lateral sites on the midfoot and forefoot) during treadmill walking. EMG activity from muscles acting at the hip, knee and ankle were recorded along with movement at these three joints. Additionally, 3 force sensing resistors measuring continuous force changes were placed at the heel, and the medial and lateral aspects of the right foot sole. All data were sorted based on stimulus occurrence in twelve step-cycle phases, before being averaged together within a phase for subsequent analysis.

Methods: Non-noxious electrical stimulation was delivered to five discrete locations on the sole of the foot (heel, and medial and lateral sites on the midfoot and forefoot) during treadmill walking. EMG activity from muscles acting at the hip, knee and ankle were recorded along with movement at these three joints. Additionally, 3 force sensing resistors measuring continuous force changes were placed at the heel, and the medial and lateral aspects of the right foot sole. All data were sorted based on stimulus occurrence in twelve step-cycle phases, before being averaged together within a phase for subsequent analysis.

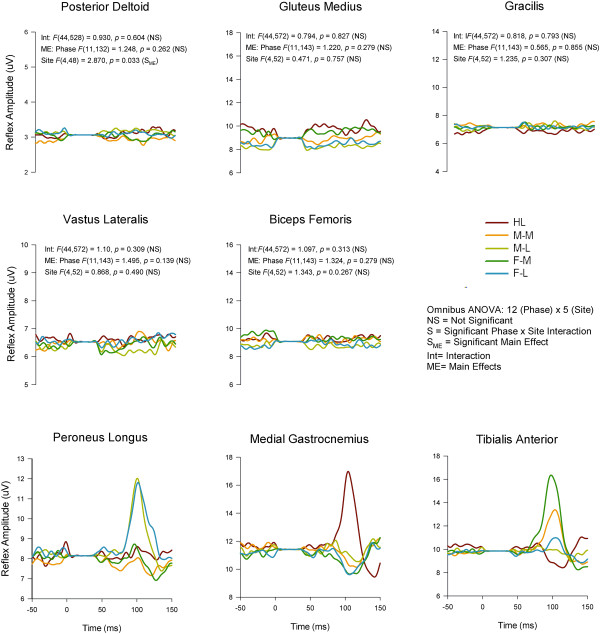
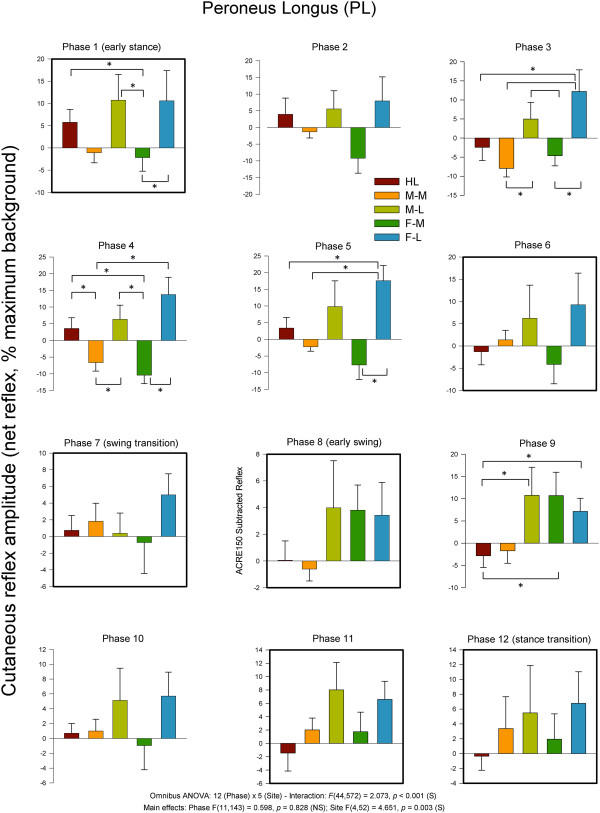
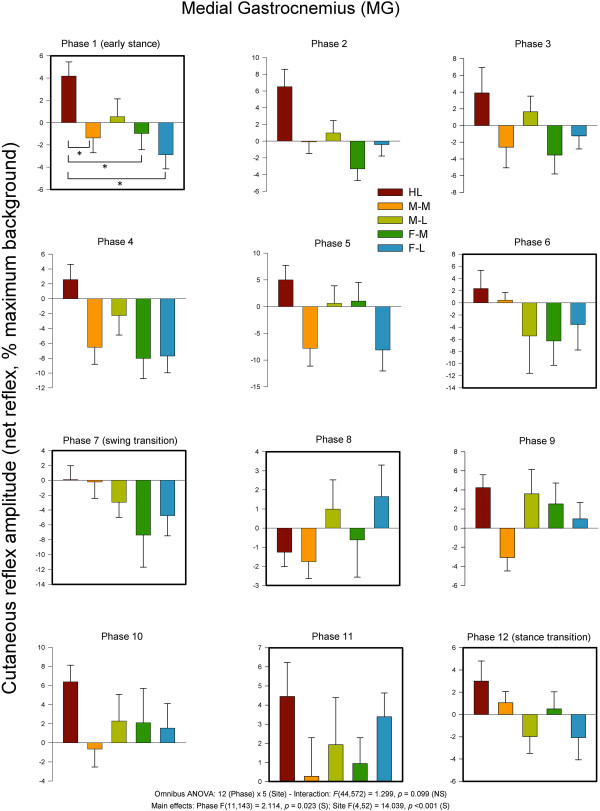
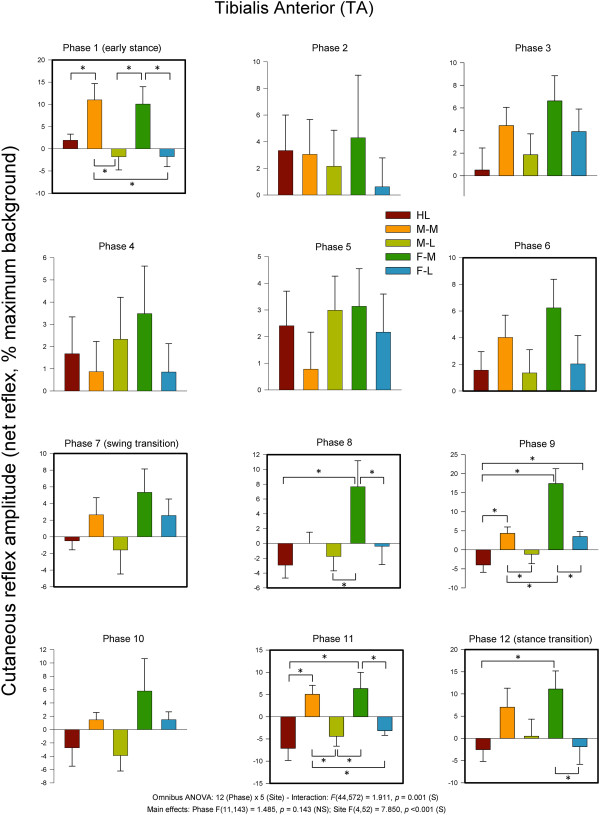
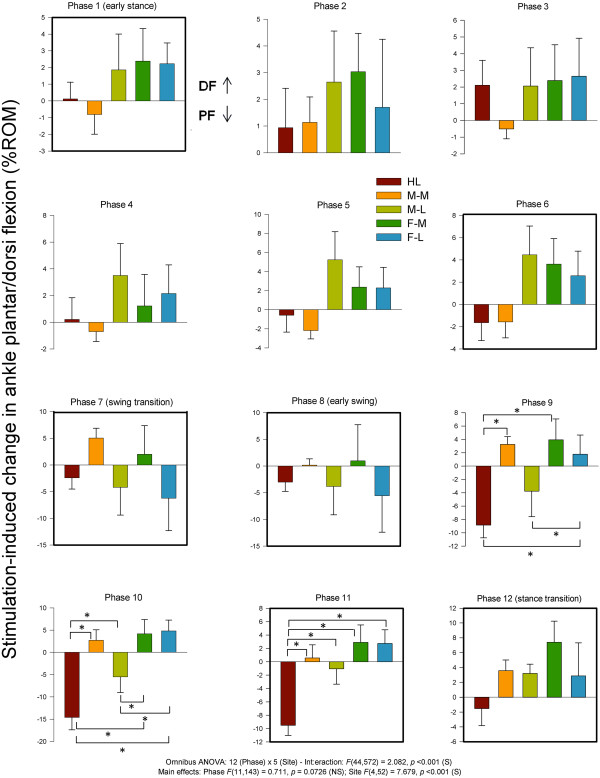
Results: The results demonstrate statistically significant dynamic changes in reflex amplitudes, kinematics and foot sole pressures that are site-specific and phase-dependent. The general trends demonstrate responses producing decreased underfoot pressure at the site of stimulation.

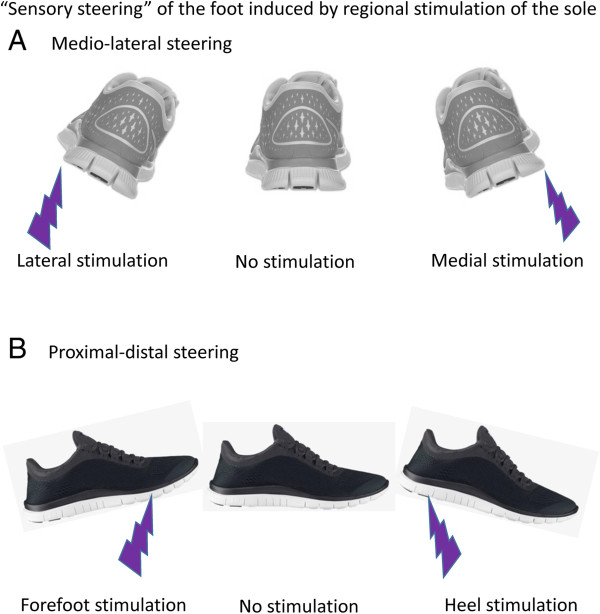
Conclusions: The responses to stimulation of discrete locations on the foot sole evoke a kind of "sensory steering" that may promote balance and maintenance of locomotion through the modulation of limb loading and foot placement. These results have implications for using sensory stimulation as a therapeutic modality during gait retraining (e.g. after stroke) as well as for footwear design and implementation of foot sole contact surfaces during gait.


Figures

Figure 1
Figure 1
Cartoon schematic illustrating the positions of the paired stimulation electrodes (solid circles) for the 5 sites: HL (S1), M-M (S2), M-L (S3), F-M (S4), and F-L (S5). The position of the force-sensing resistors (FSRs) are shown as the hatched ovals at heel (F1), medial (F2), and lateral (F3) regions. Abbreviations: M-M = mid-foot medial, M-L = mid-foot lateral, F-M = forefoot medial, F-L = forefoot lateral.
Figure 2
Figure 2
Photographs showing the configuration of the stimulating electrode array in the sock liner. A. the electrode pairs cut-out from the sock liner and overlaid with 2 sided tape; and profile of the integrated sock liner with electrode pairs and FSRs shown from the medial side (B) and from the front (C).
Figure 3
Figure 3
Schematic illustration of the walking cycle along with phase numbering for analysis and highlights of specifically targeted parts of stepping.
Figure 4
Figure 4
Grand average reflex traces taken across the entire walking cycle for all 5 stimulation conditions across all participants in all 8 muscles. Note that presentation of the data in this format shows nothing about phase-modulation since all stimulation irrespective of phase are averaged together. This presentation emphasizes the major trends in the reflexes but can obscure details such as phase-modulation. Abbreviations: HL (heel), M-M (midfoot medial), M-L (midfoot lateral), F-M (forefoot medial), F-L (forefoot lateral). The stimulus artefact beginning at time 0 has been blanked out and replaced by a flat line. The outcomes from interaction terms in the omnibus ANOVA are listed in the panel for those muscles not subjected to further analysis.
Figure 5
Figure 5
Grand average reflex traces for all 5 stimulation conditions across all Participants (n = 16) in PL, MG, and TA muscles at specific walking phases. A) early stance (phase 1), and B) swing (phase 9). Abbreviations: PL = peroneus longus, MG = medial gastrocnemius, TA = tibialis anterior. Other abbreviations as in Figure 4. Note that the stimulus artefact has been removed from all traces and replaced by a flat line extending from time 0 to ~50 ms post-stimulation.
Figure 6
Figure 6
Average quantified net (ACRE150) cutaneous reflexes across all 12 phases of the step cycle for ankle plantarflexor and evertor muscle peroneus longus. Data are percentages normalized to maximum background EMG measured across all phases of walking. Negative values indicate overall suppression and positive values overall facilitation of muscle activity. There were significant main effects for phase and stimulus region as well as a phase × region interaction. Phases of walking analyzed with planned comparisons are indicated by black borders. *indicates statistical differences at p < 0.05 between stimulation conditions within a phase.
Figure 7
Figure 7
Average quantified net (ACRE150) cutaneous reflexes across all 12 phases of the step cycle for ankle plantarflexor and evertor muscle medial gastrocnemius. Data are percentages normalized to maximum background EMG detected across all phases of walking. Negative values indicate overall suppression and positive values overall facilitation of muscle activity. There were significant main effects for phase and stimulus region. Phases of walking analyzed with planned comparisons are indicated by black borders. *indicates statistical differences at p < 0.05 between stimulation conditions within a phase.
Figure 8
Figure 8
Average quantified net (ACRE150) cutaneous reflexes across all 12 phases of the step cycle for ankle dorsiflexor and invertor muscle tibialis anterior. Data are percentages normalized to maximum background EMG detected across all phases of walking. Negative values indicate overall suppression and positive values overall facilitation of muscle activity. There were significant main effects for phase and stimulus region as well as a phase × region interaction. Phases of walking analyzed with planned comparisons are indicated by black borders. *indicates statistical differences at p < 0.05 between stimulation conditions within a phase.
Figure 9
Figure 9
Stimulation-induced average changes in forces under the foot detected by FSRs at the heel. Data are percentages normalized to maximum FSR load detected in the stance phase of walking. Phases of walking analyzed with planned comparisons are indicated by black borders. *indicates statistical differences at p < 0.05 between stimulation conditions within a phase.
Figure 10
Figure 10
Stimulation-induced average changes in forces under the foot detected by FSRs at the medial foot. Data are percentages normalized to maximum FSR load detected in the stance phase of walking. Phases of walking analyzed with planned comparisons are indicated by black borders. *indicates statistical differences at p < 0.05 between stimulation conditions within a phase.
Figure 11
Figure 11
Stimulation-induced average changes in forces under the foot detected by FSRs at the lateral margin. Data are percentages normalized to maximum FSR load detected in the stance phase of walking. Phases of walking analyzed with planned comparisons are indicated by black borders. *indicates statistical differences at p < 0.05 between stimulation conditions within a phase.
Figure 12
Figure 12
Stimulation-induced average changes in ankle joint kinematics for inversion/eversion (eversion = up). Data are percentages normalized to maximum range of motion across all phases of walking. Phases of walking analyzed with planned comparisons are indicated by black borders. *indicates statistical differences at p < 0.05 between stimulation conditions within a phase.
Figure 13
Figure 13
Stimulation-induced average changes in ankle joint kinematics for dorsiflexion and plantarflexion (dorsiflexion = up). Data are percentages normalized to maximum range of motion across all phases of walking. Phases of walking analyzed with planned comparisons are indicated by black borders. *indicates statistical differences at p < 0.05 between stimulation conditions within a phase.
Figure 14
Figure 14
Cartoon schematic illustrating the overall neuromechanical outcomes (“sensory steering”) found in the data. Medio-lateral steering around a longitudinal axis is shown in (A) and proximal-distal steering along a transverse axis is shown in (B). “Sensory steering” is as shown in this schematic is not meant as a literal representation of the amplitude of the evoked evokes at each phase of walking. Rather it is a general distillation of the overall neuromechanical outcomes found in our data.

Similar articles

Cited by

References

    1. Inglis JT, Kennedy PM, Wells C, Chua R. The role of cutaneous receptors in the foot. Adv Exp Med Biol. 2002;508:111–117. doi: 10.1007/978-1-4615-0713-0_14. - DOI - PubMed
    1. Kennedy PM, Inglis JT. Distribution and behaviour of glabrous cutaneous receptors in the human foot sole. J Physiol. 2002;538(3):995–1002. doi: 10.1113/jphysiol.2001.013087. - DOI - PMC - PubMed
    1. Zehr EP, Stein RB. What functions do reflexes serve during human locomotion? Prog Neurobiol. 1999;58:185–205. doi: 10.1016/S0301-0082(98)00081-1. - DOI - PubMed
    1. Zehr EP, Komiyama T, Stein RB. Cutaneous reflexes during human gait: electromyographic and kinematic responses to electrical stimulation. J Neurophysiol. 1997;77(6):3311–3325. - PubMed
    1. Van Wezel BM, Ottenhoff FA, Duysens J. Dynamic control of location-specific information in tactile cutaneous reflexes from the foot during human walking. J Neurosci. 1997;17(10):3804–3814. - PMC - PubMed