. 2014 Oct;124(10):4473-88.
doi: 10.1172/JCI75276. Epub 2014 Sep 9.

The arcuate nucleus mediates GLP-1 receptor agonist liraglutide-dependent weight loss

The arcuate nucleus mediates GLP-1 receptor agonist liraglutide-dependent weight loss

Anna Secher et al. J Clin Invest. 2014 Oct.

Abstract

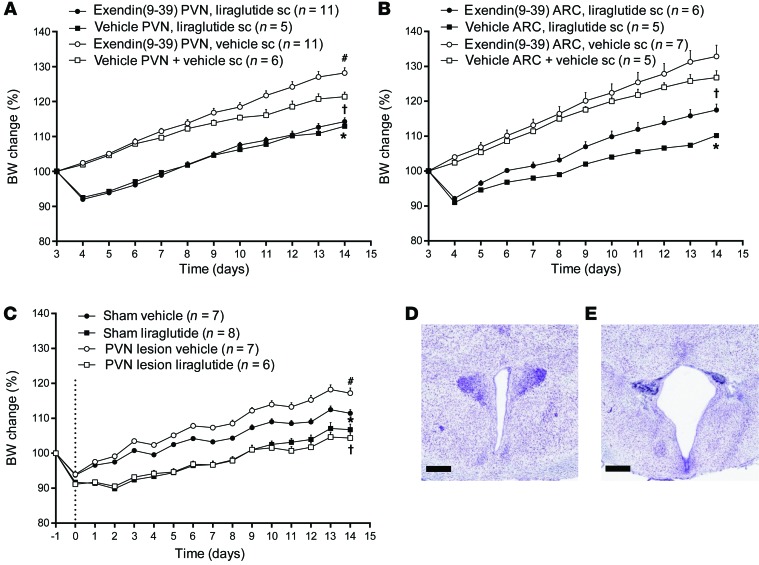
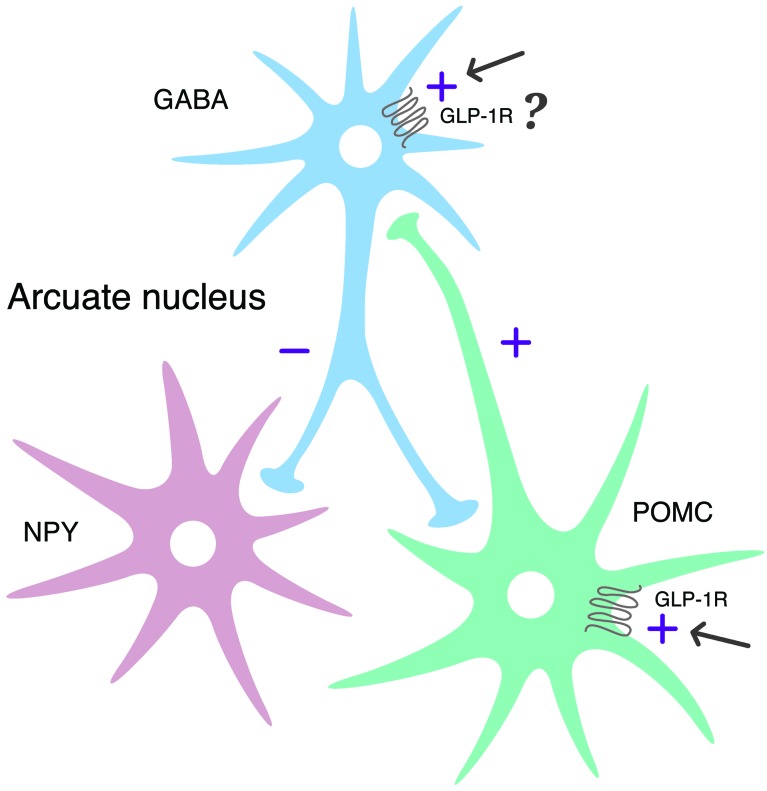
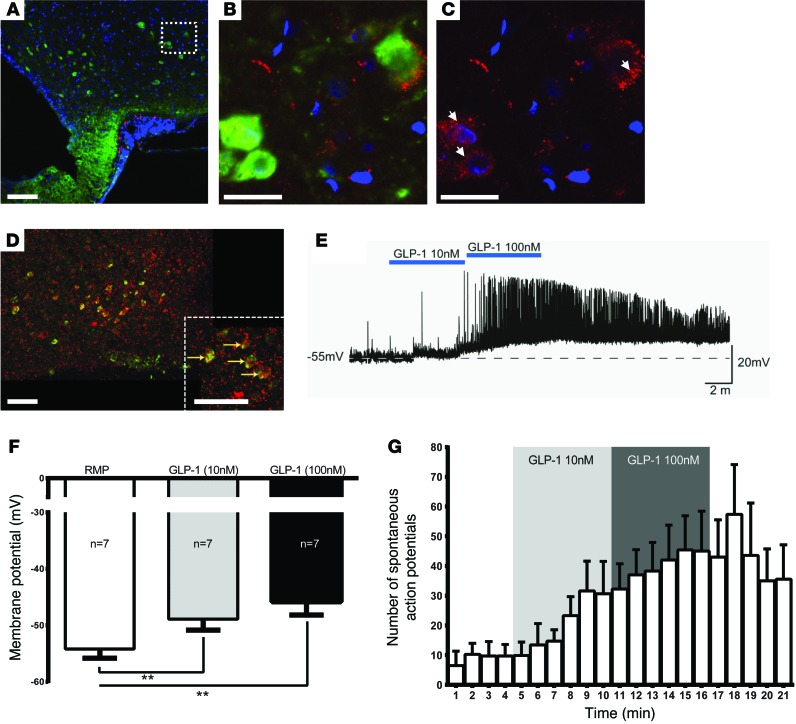
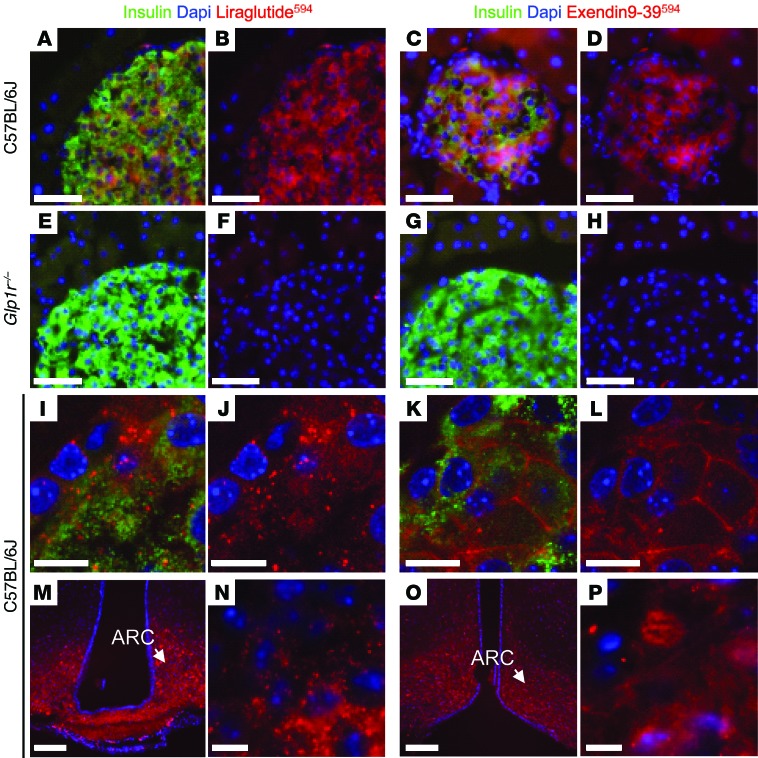
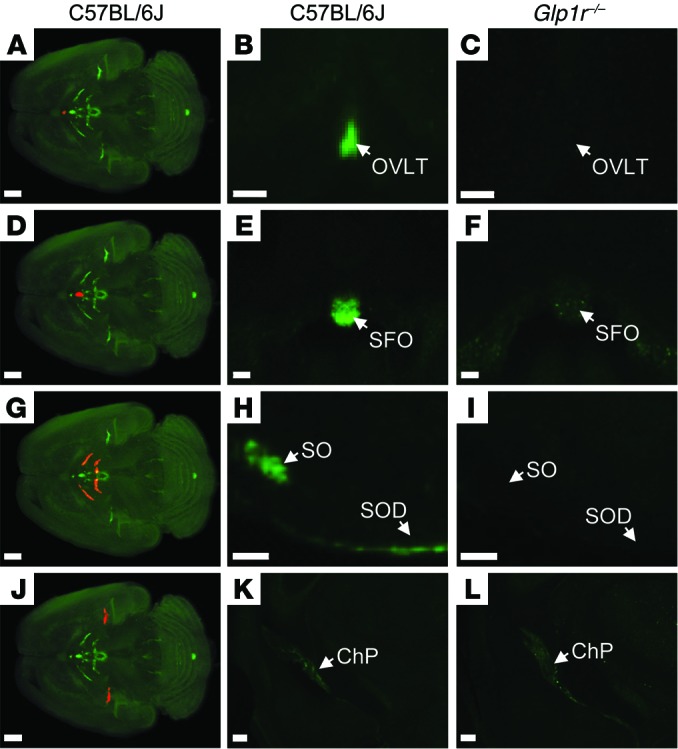
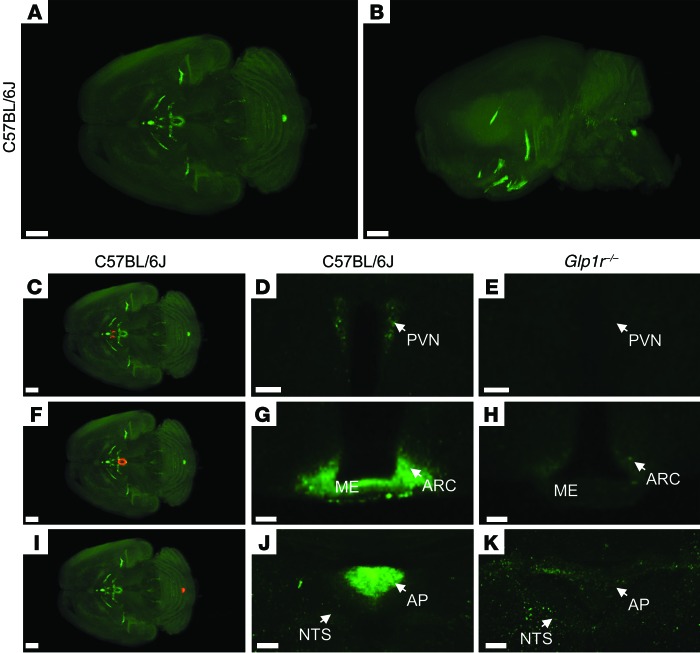
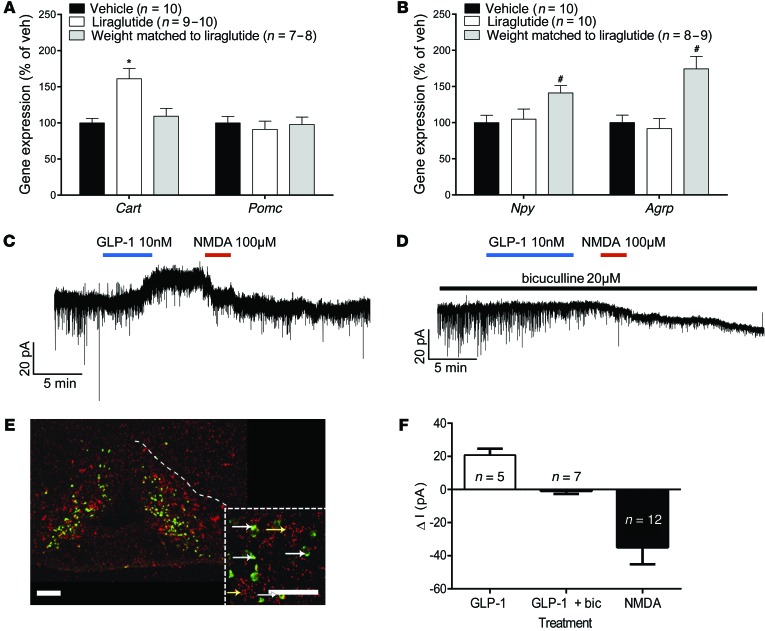
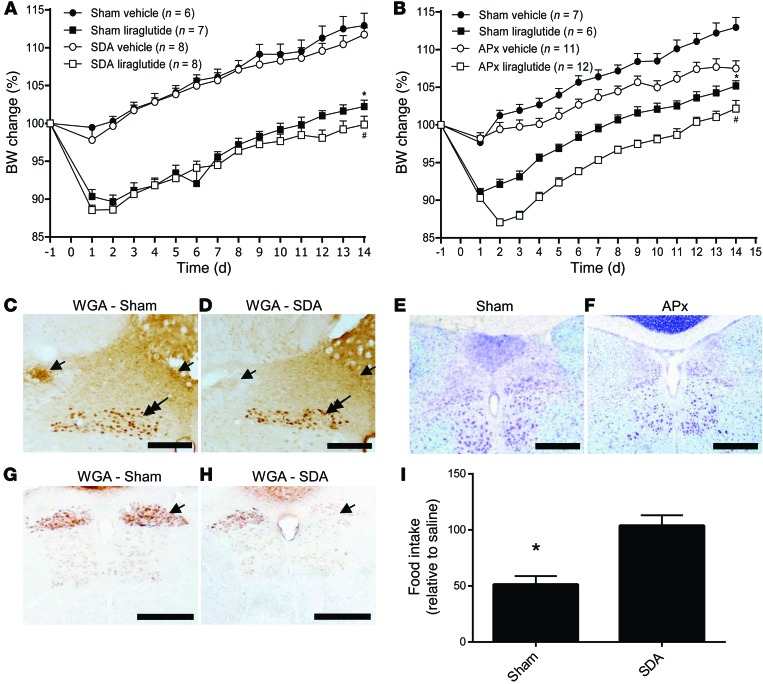
Liraglutide is a glucagon-like peptide-1 (GLP-1) analog marketed for the treatment of type 2 diabetes. Besides lowering blood glucose, liraglutide also reduces body weight. It is not fully understood how liraglutide induces weight loss or to what degree liraglutide acts directly in the brain. Here, we determined that liraglutide does not activate GLP-1-producing neurons in the hindbrain, and liraglutide-dependent body weight reduction in rats was independent of GLP-1 receptors (GLP-1Rs) in the vagus nerve, area postrema, and paraventricular nucleus. Peripheral injection of fluorescently labeled liraglutide in mice revealed the presence of the drug in the circumventricular organs. Moreover, labeled liraglutide bound neurons within the arcuate nucleus (ARC) and other discrete sites in the hypothalamus. GLP-1R was necessary for liraglutide uptake in the brain, as liraglutide binding was not seen in Glp1r(-/-) mice. In the ARC, liraglutide was internalized in neurons expressing proopiomelanocortin (POMC) and cocaine- and amphetamine-regulated transcript (CART). Electrophysiological measurements of murine brain slices revealed that GLP-1 directly stimulates POMC/CART neurons and indirectly inhibits neurotransmission in neurons expressing neuropeptide Y (NPY) and agouti-related peptide (AgRP) via GABA-dependent signaling. Collectively, our findings indicate that the GLP-1R on POMC/CART-expressing ARC neurons likely mediates liraglutide-induced weight loss.


Figures

Figure 8
Figure 8. PVN and ARC contributions to liraglutide-induced body weight change.
(A) Exendin(9-39) led to a significant increase in body weight when administered into the PVN, whereas liraglutide treatment reduced body weight gain significantly alone and in combination with exendin(9-39) (*P < 0.001, vehicle PVN + liraglutide s.c. vs. vehicle PVN + vehicle s.c.; P < 0.001, vehicle PVN + vehicle s.c. vs. exendin(9-39) PVN + liraglutide s.c.; #P < 0.001, exendin(9-39) PVN + vehicle s.c. vs. vehicle PVN + vehicle s.c.). (B) Exendin(9-39) led to a slight but nonsignificant increase in body weight when administered into the ARC, whereas the effect of liraglutide treatment was attenuated when administered in combination with exendin(9-39) (*P < 0.001, vehicle ARC + liraglutide s.c. vs. vehicle ARC + vehicle s.c.; P < 0.001, vehicle ARC + vehicle s.c. vs. exendin(9-39) ARC + liraglutide s.c). (C) Lesion of the PVN led to a significant increase in body weight (#P < 0.001, PVN lesion + vehicle vs. sham + vehicle), whereas animals with PVN lesions were fully responsive to the weight loss induced by liraglutide (*P < 0.01, sham vehicle vs. sham liraglutide; P < 0.001, PVN lesion + vehicle vs. PVN lesion + liraglutide). The PVN lesion was histologically verified in (D) sham and (E) PVN-lesioned rats. Data are mean ± SEM, and statistical analyses are performed using 2-way repeated-measures ANOVA, with Bonferroni post-hoc analyses applied. Scale bars: 500 μm.
Figure 7
Figure 7. Proposed regulation of neuronal activation by liraglutide.
Summary diagram demonstrating the suggested regulatory pathway of GLP-1 on ARC NPY and POMC neurons. GLP-1 stimulates POMC neurons directly through the GLP-1R and is suggested to indirectly inhibit ARC-NPY neurons through an local inhibitory GABA neuron.
Figure 6
Figure 6. Neuronal accumulation and activity following GLP-1R stimulation.
(AC) Hypothalamic sections from rats injected with liraglutide594 (red) and stained with Hoechst nuclear stain (blue) and CART (green). (B and C) High-magnification confocal images revealed accumulation of fluoro liraglutide in the cytoplasm of CART-positive cells (arrows). (B) CART- and liraglutide594-positive cells. (C) The same image as in B with only liraglutide594 signal. (D) Double in situ hybridization/immunohistochemistry staining revealed that GLP-1R (red) colocalize (yellow arrows) with POMC/CART (green) in the ARC. (E) GLP-1 (10 nM and 100 nM) caused membrane depolarization and increased firing rate of spontaneous action potentials in POMC/CART cells. Dashed line indicates the resting membrane potential (RMP). The effects of increased concentrations of GLP-1(7-36)amide are summarized in F. (G) The effects of GLP-1(7-36)amide on firing rate of spontaneous action potentials in POMC/CART neurons. Results are shown as mean ± SEM. Scale bars: 25 μm (B and C); 100 μm (A and D). **P < 0.01 one-way ANOVA, post-hoc Bonferroni’s correction.
Figure 5
Figure 5. Distribution of liraglutide594 or exendin(9-39)594 in pancreas and brain.
(AL) Representative images of mouse islets stained with Hoechst nuclear stain (blue), insulin (green), and liraglutide594/exendin(9-39)594 (red). (AD) In C57BL/6J mice, both liraglutide594 and exendin(9-39)594 were detected in cells expressing insulin; (EH) however, in mice lacking a functional GLP-1R, no liraglutide594 or exendin(9-39)594 signal could be detected in insulin expressing β cells. (I, J, and N) High-magnification images showed that liraglutide594 was internalized and the fluorescent signal was located in the cytoplasm, (K, L, and P) while exendin(9-39)594 remained at the plasma membrane. In the brain, (M and N) liraglutide594 had access to ARC, in which it bound the GLP-1R and internalized, (O and P) while exendin(9-39)594 labeled the same population of cells but without internalization. Scale bars: 100 μm (M and O), 50 μm (AH), 10 μm (IL, N, and P).
Figure 4
Figure 4. Distribution of fluorescently labeled liraglutide in the mouse brain.
The brain tissue was scanned at 620 nm and 710 nm, representing both autofluorescence from the tissue (gray) and specific signal (green). The red regions in A, D, G, and J are shown at higher magnification in B, E, H and K, respectively (unspecific staining has been removed as described in Supplemental Figure 2). Images in the middle and right columns represent enlargements of a single section from (B, E, H, and K) C57BL/6J or (C, F, I, and L) Glp1r–/– mice administered with liraglutide750. Liraglutide750 was detectable in (A and B) organum vasculosum of the lamina terminalis, (D and E) subfornical organ, (G and H) supraoptic nucleus and supraoptic decussation, and (J and K) ChP. (C, F, I, and L) In mice lacking a functional GLP-1R, no liraglutide750 signal could be detected in any of these regions except from ChP. Scale bars: 200 μm (A, D, G, and JL); 100 μm (B, C, E, F, H, and I). OVLT, organum vasculosum of lamina terminalis; SFO, subfornical organ; SO, supraoptic nucleus; SOD, supraoptic decussation.
Figure 3
Figure 3. Distribution of fluorescently labeled liraglutide in the mouse brain.
Representative whole brain images viewed in the (A) dorsoventral or (B) sagittal plane from C57BL/6J mice administered with liraglutide750 (unspecific staining has been removed from the left side of the brain, as described in Supplemental Figure 2). The brain tissue was scanned at 620 nm and 710 nm, representing both autofluorescence from the tissue (gray) and specific signal (green). The red regions in C, F, and I are shown at higher magnification in D, G, and J, respectively. Images in D, E, G, H, J, and K show high-magnification views of a single section from (D, G, and J) C57BL/6J or (E, H, and K) Glp1r–/– mice administered liraglutide750. Liraglutide750 was detectable in (C and D) PVN, (F and G) ME and ARC, and (I and J) AP. (E, H, and K) In mice lacking a functional GLP-1R, no liraglutide750 signal could be detected in any of these regions. Scale bars: 200 μm (A, B, C, F, and I); 50 μm (D and E); 100 μm (G, H, J, and K).
Figure 2
Figure 2. Liraglutide treatment regulates ARC gene expression and ARC neuronal activity.
(A) Liraglutide treatment for 28 days in DIO rats significantly increased mean Cart mRNA levels in the ARC (*P < 0.001 liraglutide vs. vehicle and vs. weight matched), whereas Pomc expression was unaffected. (B) Npy and Agrp mRNA levels were significantly increased in weight-matched rats — but not following treatment with liraglutide (#P < 0.05 weight matched vs. vehicle and vs. liraglutide). Data are mean ± SEM, and statistical analyses were performed using 1-way ANOVA, with Fishers post-hoc test. (C) Voltage-clamp recording of ARC-NPY neurons showed an increased outward current in the presence of GLP-1(7-36)amide (blue line) and an inward current with NMDA (red line). (D) Simultaneous GABA receptor inhibition by bicuculline (black line) showed a lack of change in the current with the addition of GLP-1(7-36)amide; however, NMDA retained the ability to cause an inward current. (E) The action of GLP-1(7-36) amide was not directly through GLP-1Rs on NPY/AgRP neurons, as no colocalization was observed between GLP-1R– (red, yellow arrows) and NPY/AgRP-positive (green, white arrows) neurons. Scale bars: 100 μm. (F) The effects of GLP-1(7-36)amide in the presence of bicuculline or NMDA on ARC-NPY neurons are summarized (mean ± SEM).
Figure 1
Figure 1. Vagal and AP contributions to liraglutide body weight change.
(A) Liraglutide treatment reduced body weight gain significantly in both sham and SDA rats (*P < 0.001 sham vehicle vs. sham liraglutide; #P < 0.001 SDA vehicle vs. SDA liraglutide). (B) Whereas AP lesion changed the body weight set point, liraglutide treatment reduced body weight gain to the same degree in both sham and AP-ablated animals (*P < 0.001 sham vehicle vs. sham liraglutide; #P < 0.001 APx vehicle vs. APx liraglutide). (C and D) Wheat germ agglutinin (WGA) injected into the left nodose ganglion labeled afferent fibers in sham animals only (arrows). Note persistence of retrograde labeled dorsal motor nucleus neurons in both groups (double arrows). (E and F) Ablation of AP was verified histologically in (E) sham and (F) AP-ablated rats. Data are mean ± SEM, and statistical analyses are performed using 2-way repeated-measures ANOVA, with Bonferroni post-hoc analyses applied. (G and H) Efferent labeling of fluorogold injected i.p. was reduced in the gastrointestinal part of dorsal motor nucleus due to right truncal vagotomy (arrows). (I) CCK8 (8 μg/kg i.p.) reduced 30-minute food intake in sham rats but not in SDA-operated rats (*P < 0.01). Scale bars: 200 μm (C and D), 500 μm (EH).

Comment in

References

    1. Nathan PJ, O’Neill BV, Napolitano A, Bullmore ET. Neuropsychiatric adverse effects of centrally acting antiobesity drugs. CNS Neurosci Ther. 2011;17(5):490–505. doi: 10.1111/j.1755-5949.2010.00172.x. - DOI - PMC - PubMed
    1. Suzuki K, Jayasena CN, Bloom SR. Obesity and appetite control. Exp Diabetes Res. 2012;2012:824305. - PMC - PubMed
    1. Dong CX, Brubaker PL. Ghrelin, the proglucagon-derived peptides and peptide YY in nutrient homeostasis. Nat Rev Gastroenterol Hepatol. 2012;9(12):705–715. doi: 10.1038/nrgastro.2012.185. - DOI - PubMed
    1. Vrang N, Larsen PJ. Preproglucagon derived peptides GLP-1, GLP-2 and oxyntomodulin in the CNS: role of peripherally secreted and centrally produced peptides. Prog Neurobiol. 2010;92(3):442–462. doi: 10.1016/j.pneurobio.2010.07.003. - DOI - PubMed
    1. Babilon S, Mörl K, Beck-Sickinger AG. Towards improved receptor targeting: anterograde transport, internalization and postendocytic trafficking of neuropeptide Y receptors. Biol Chem. 2013;394(8):921–936. - PubMed

Publication types

MeSH terms