

Sequencing an Ashkenazi reference panel supports population-targeted personal genomics and illuminates Jewish and European origins
- PMID: 25203624
- PMCID: PMC4164776
- DOI: 10.1038/ncomms5835
Sequencing an Ashkenazi reference panel supports population-targeted personal genomics and illuminates Jewish and European origins
Abstract
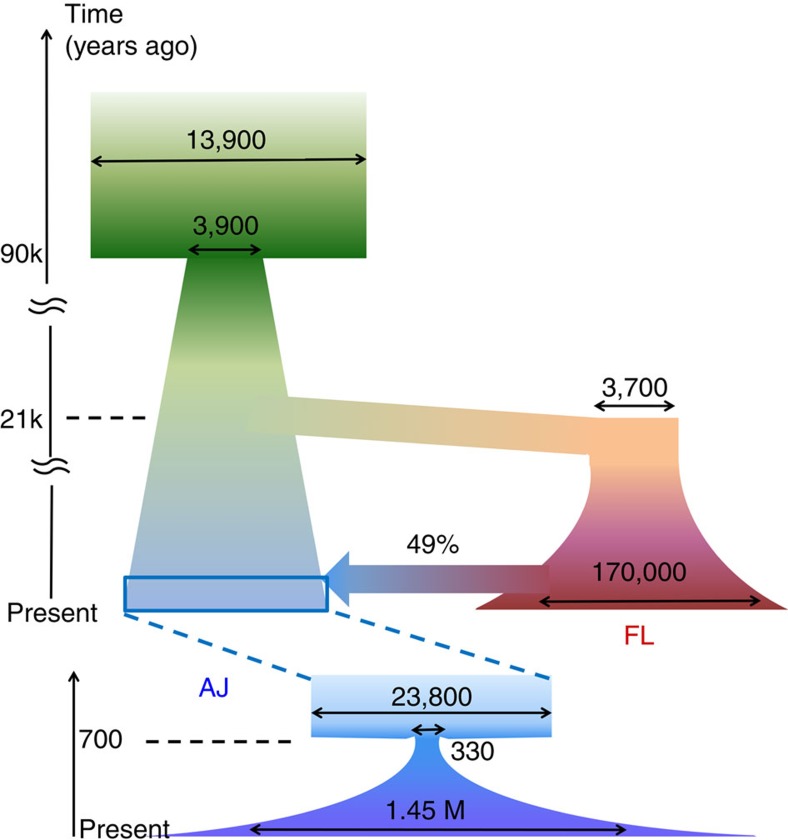
The Ashkenazi Jewish (AJ) population is a genetic isolate close to European and Middle Eastern groups, with genetic diversity patterns conducive to disease mapping. Here we report high-depth sequencing of 128 complete genomes of AJ controls. Compared with European samples, our AJ panel has 47% more novel variants per genome and is eightfold more effective at filtering benign variants out of AJ clinical genomes. Our panel improves imputation accuracy for AJ SNP arrays by 28%, and covers at least one haplotype in ≈ 67% of any AJ genome with long, identical-by-descent segments. Reconstruction of recent AJ history from such segments confirms a recent bottleneck of merely ≈ 350 individuals. Modelling of ancient histories for AJ and European populations using their joint allele frequency spectrum determines AJ to be an even admixture of European and likely Middle Eastern origins. We date the split between the two ancestral populations to ≈ 12-25 Kyr, suggesting a predominantly Near Eastern source for the repopulation of Europe after the Last Glacial Maximum.
Figures
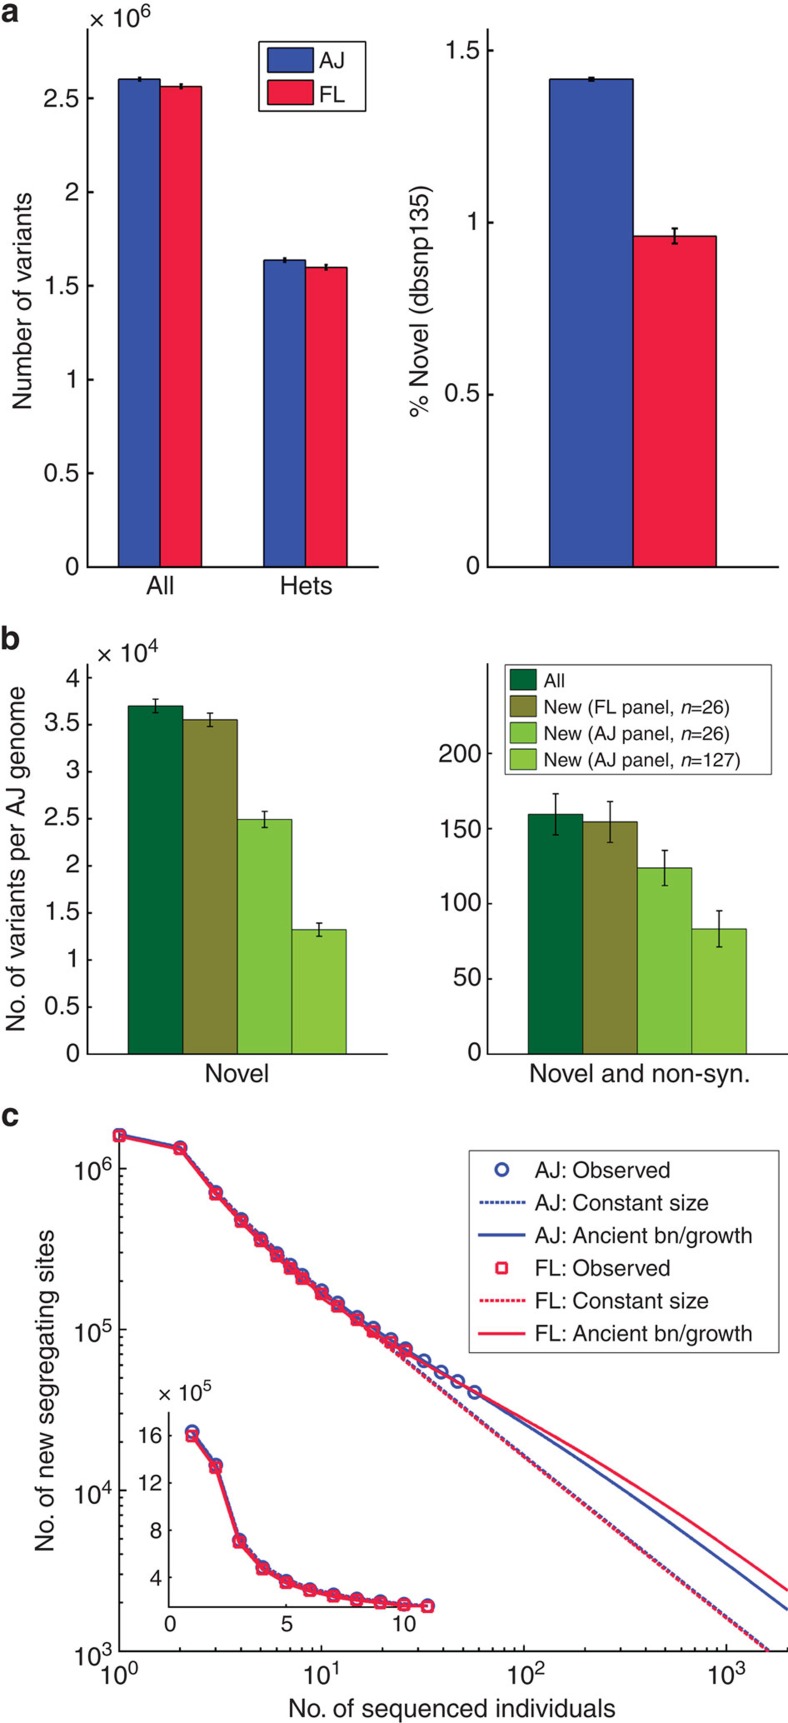
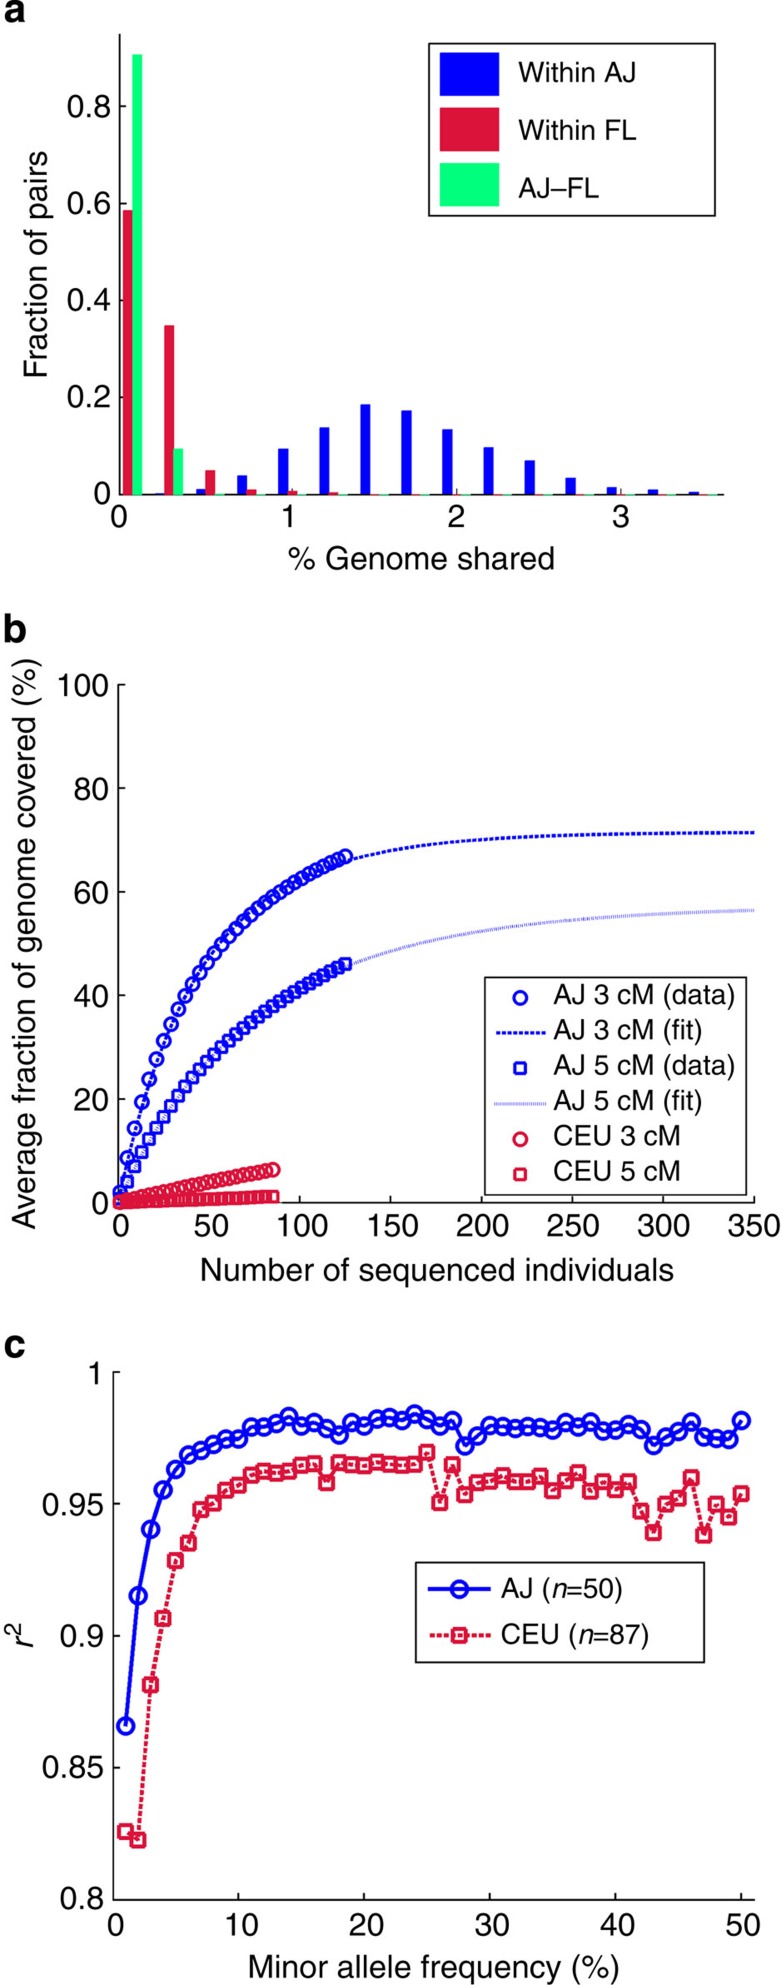
 (lines), where c is the average coverage and n is the number of individuals in the panel (Supplementary Note 4). (c) The aggregate r2 (over the AJ study genomes) between the true and the imputed dosages versus the minor allele frequency, when imputing an AJ genome using a reference panel consisting of either AJ or CEU genomes.
References
-
- Goodman R. M. Genetic Disorders among the Jewish People The Johns Hopkins University Press (1979).
-
- Ozelius L. J. et al. LRRK2 G2019S as a cause of Parkinson's disease in Ashkenazi Jews. N. Engl. J. Med. 354, 424–425 (2006). - PubMed
-
- Struewing J. P. et al. The risk of cancer associated with specific mutations of BRCA1 and BRCA2 among Ashkenazi Jews. N. Engl. J. Med. 336, 1401–1408 (1997). - PubMed
Publication types
MeSH terms
Grants and funding
- NS050487/NS/NINDS NIH HHS/United States
- DK062422/DK/NIDDK NIH HHS/United States
- DK098927/DK/NIDDK NIH HHS/United States
- R01 MH084098/MH/NIMH NIH HHS/United States
- T32 AG023475/AG/NIA NIH HHS/United States
- R21 NS050487/NS/NINDS NIH HHS/United States
- U01 DK062429/DK/NIDDK NIH HHS/United States
- MH089964/MH/NIMH NIH HHS/United States
- AG021654/AG/NIA NIH HHS/United States
- AG042188/AG/NIA NIH HHS/United States
- P01 AG027734/AG/NIA NIH HHS/United States
- RC2 MH089964/MH/NIMH NIH HHS/United States
- MH095458/MH/NIMH NIH HHS/United States
- DK092235/DK/NIDDK NIH HHS/United States
- MH084098/MH/NIMH NIH HHS/United States
- R01 DK092235/DK/NIDDK NIH HHS/United States
- R01 MH095458/MH/NIMH NIH HHS/United States
- R01 AG042188/AG/NIA NIH HHS/United States
- GM007205/GM/NIGMS NIH HHS/United States
- NS060113/NS/NINDS NIH HHS/United States
- P01 AG021654/AG/NIA NIH HHS/United States
- U24 DK062429/DK/NIDDK NIH HHS/United States
- F30 DK098927/DK/NIDDK NIH HHS/United States
- CA121852/CA/NCI NIH HHS/United States
- P30 CA008748/CA/NCI NIH HHS/United States
- DK62429/DK/NIDDK NIH HHS/United States
- AG027734/AG/NIA NIH HHS/United States
- U01 DK062422/DK/NIDDK NIH HHS/United States
- U54 CA121852/CA/NCI NIH HHS/United States
- R01 NS060113/NS/NINDS NIH HHS/United States
- T32 GM007205/GM/NIGMS NIH HHS/United States
- UL1 TR001073/TR/NCATS NIH HHS/United States
LinkOut - more resources
Full Text Sources
Other Literature Sources
Molecular Biology Databases
