. 2014 Sep 9:13:209.
doi: 10.1186/1476-4598-13-209.

Survivin expression promotes VEGF-induced tumor angiogenesis via PI3K/Akt enhanced β-catenin/Tcf-Lef dependent transcription

Affiliations

Survivin expression promotes VEGF-induced tumor angiogenesis via PI3K/Akt enhanced β-catenin/Tcf-Lef dependent transcription

Jaime G Fernández et al. Mol Cancer. .

Abstract

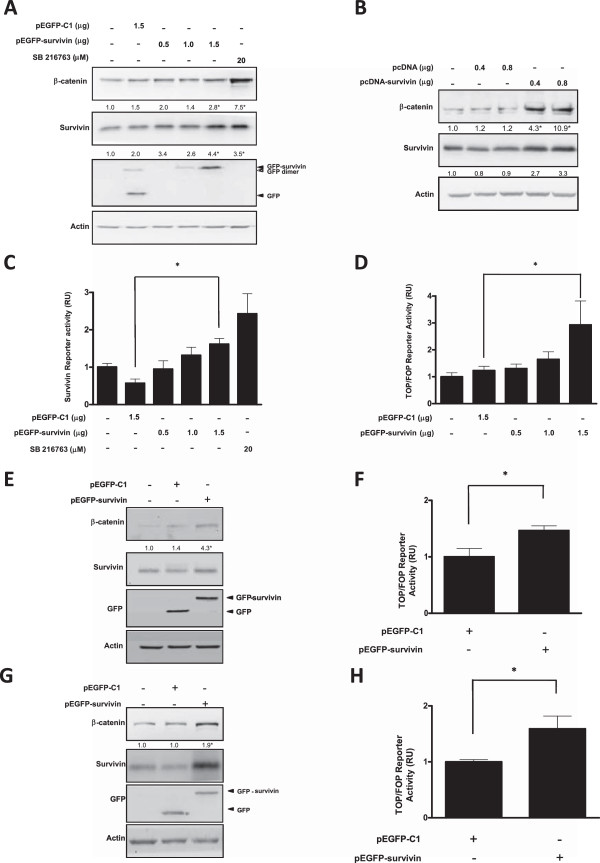
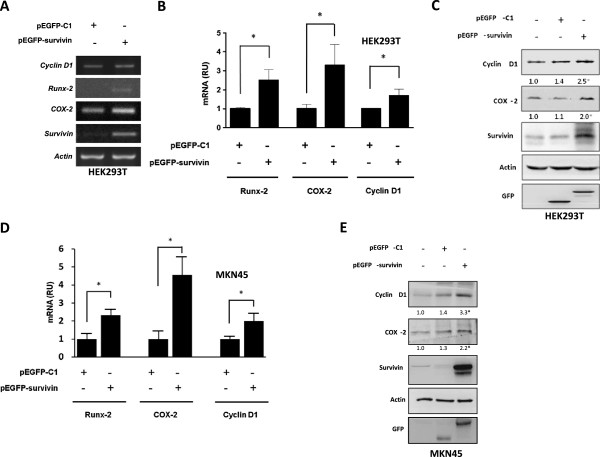
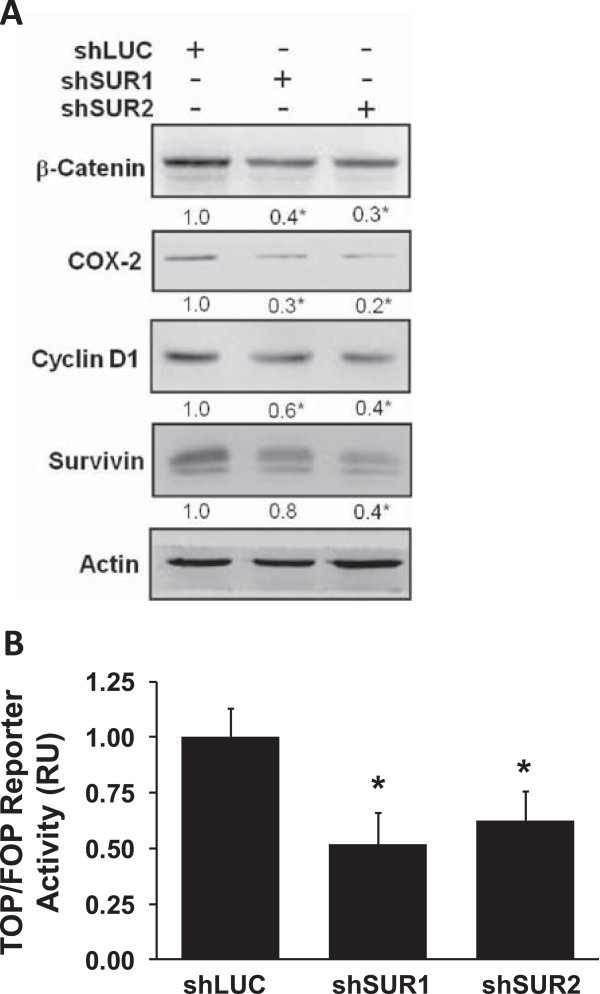
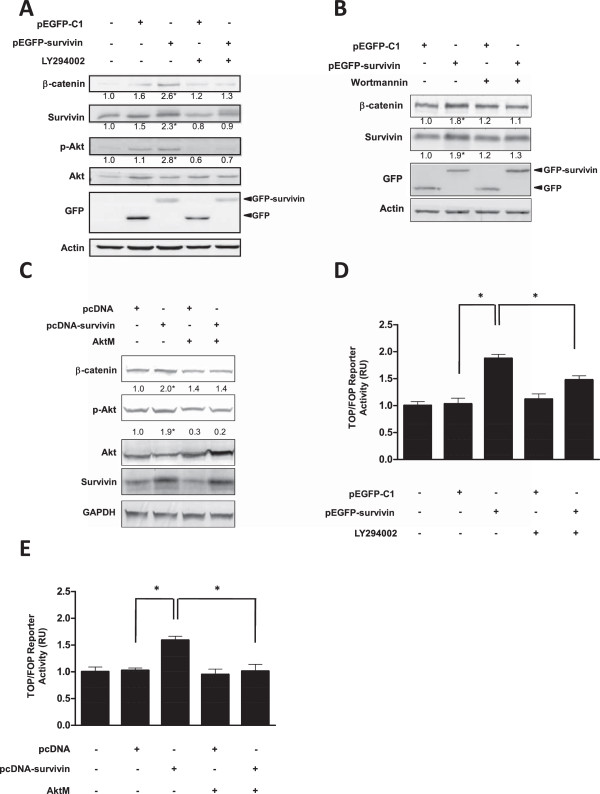
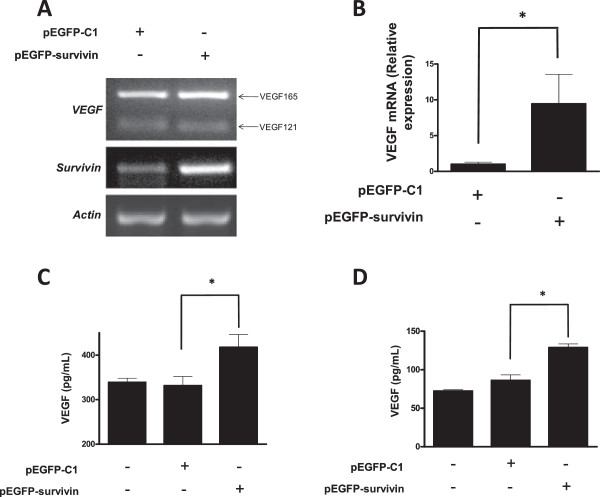
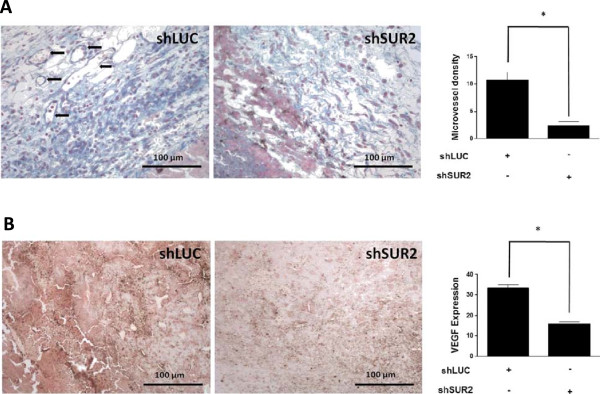
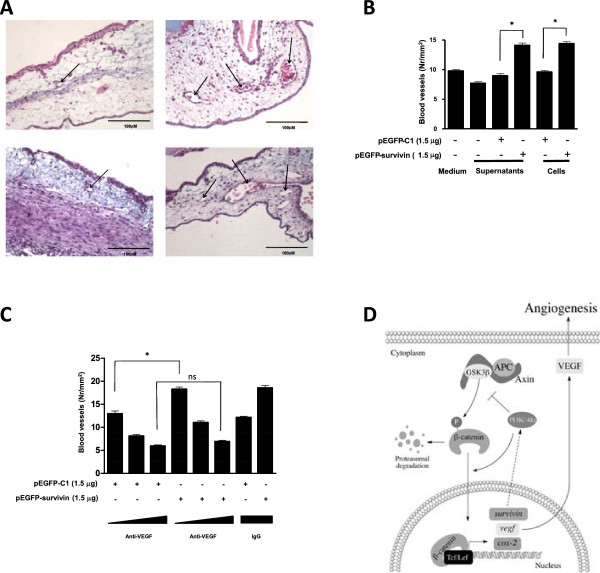
Early in cancer development, tumour cells express vascular endothelial growth factor (VEGF), a secreted molecule that is important in all stages of angiogenesis, an essential process that provides nutrients and oxygen to the nascent tumor and thereby enhances tumor-cell survival and facilitates growth. Survivin, another protein involved in angiogenesis, is strongly expressed in most human cancers, where it promotes tumor survival by reducing apoptosis as well as favoring endothelial cell proliferation and migration. The mechanisms by which cancer cells induce VEGF expression and angiogenesis upon survivin up-regulation remain to be fully established. Since the PI3K/Akt signalling and β-catenin-Tcf/Lef dependent transcription have been implicated in the expression of many cancer-related genes, including survivin and VEGF, we evaluated whether survivin may favor VEGF expression, release from tumor cells and induction of angiogenesis in a PI3K/Akt-β-catenin-Tcf/Lef-dependent manner. Here, we provide evidence linking survivin expression in tumor cells to increased β-catenin protein levels, β-catenin-Tcf/Lef transcriptional activity and expression of several target genes of this pathway, including survivin and VEGF, which accumulates in the culture medium. Alternatively, survivin downregulation reduced β-catenin protein levels and β-catenin-Tcf/Lef transcriptional activity. Also, using inhibitors of PI3K and the expression of dominant negative Akt, we show that survivin acts upstream in an amplification loop to promote VEGF expression. Moreover, survivin knock-down in B16F10 murine melanoma cells diminished the number of blood vessels and reduced VEGF expression in tumors formed in C57BL/6 mice. Finally, in the chick chorioallantoid membrane assay, survivin expression in tumor cells enhanced VEGF liberation and blood vessel formation. Importantly, the presence of neutralizing anti-VEGF antibodies precluded survivin-enhanced angiogenesis in this assay. These findings provide evidence for the existance of a posititve feedback loop connecting survivin expression in tumor cells to PI3K/Akt enhanced β-catenin-Tcf/Lef-dependent transcription followed by secretion of VEGF and angiogenesis.


Figures

Figure 1
Figure 1
Survivin expression increased endogenous survivin and β-catenin protein levels, as well as β-catenin/Tcf-Lef dependent transcriptional activity: A,B: HEK293T cells (5×10 5 ) were transfected with pEGFP-C1 or pEGFP-survivin (A), pcDNA or pcDNA-survivin (B) or treated with SB216763 (20 μM), a pharmacological inhibitor of GSK-3β. β-catenin, survivin and actin protein levels were evaluated by western blotting. Protein levels were quantified by scanning densitometric analysis of western blots and normalized to actin. In panel A second lane, a band reflecting GFP dimerization is also visible. C,D: HEK293T cells (5×10⁵) were seeded in 6-well plates and transiently cotransfected with pEGFP-C1 (1.5 μg) or pEGFP-survivin (0.5-1.5 μg) and additionally with the reporter plasmids pLuc-1710 (intact survivin promoter, 1 μg) pLuc-3M (survivin promoter with 2 TBEs mutated, 1 μg) (C), pTOP-FLASH (three functional TBEs in tandem) or pFOP-FLASH (all TBEs mutated, 1 μg each) (D). Luciferase activity was obtained by calculating the pLuc 1710/pLuc 3M or the pTOP-FLASH/pFOP-FLASH activity ratios for each condition. Data were previously normalized to values for β-galactosidase activity. E-H: NIH3T3 (E,F) cells (5×10⁵) or MKN45 (G,H) cells (5×10⁵) were seeded in 6-well plates and transiently transfected with pEGFP-C1 or pEGFP-survivin (1 μg each). E-G: β-catenin, survivin, GFP and actin protein levels were evaluated by western bloting. F-H: cells were cotransfected with pTOP-FLASH or pFOP-FLASH (1 μg) vectors and luciferase activity was obtained by calculating the pTOP-FLASH/pFOP-FLASH activity ratios for each condition. Data were previously normalized to values for β-galactosidase activity. Numerical data shown are the means ± s.e.m. of results obtained in three independent experiments. Statistically significant differences compared to mock controls are indicated (*p < 0.05).
Figure 2
Figure 2
Survivin expression increased mRNA and protein levels of β-catenin/Tcf-Lef target genes: A,B: HEK293T cells (5 × 10 5 ) were seeded in 6-well plates and transfected with pEGFP-C1 or pEGFP-survivin (1.5 μg). A: After 24 h Cyclin D1, Runx-2, COX-2 and survivin mRNA levels were assessed by semi-quantitative RT-PCR. Actin was used as an internal control B: Runx-2,COX-2 and Cyclin D1 mRNA levels were assessed by qPCR. Ribosomal 18S RNA was used as an internal control. Relative Units (RU) reflect normalization to controls. Values are means of results obtained in three independent experiments. Statistically significant differences compared to mock-transfected controls are indicated (* p < 0.05). C: Cyclin D1, COX-2 and endogenous survivin levels were evaluated by western blotting. Actin was used as an internal control. Expression of GFP and GFP-survivin in the respective lanes was revealed with a GFP-specific antibody. D, E: Wild type MKN45 gastric cancer cells (5×10⁵) were seeded in 6-well plates and transfected with with pEGFP-C1 or pEGFP-survivin (1.5 μg). After 24 h mRNA and protein levels were assessed by qPCR and western blotting, respectively. D: Runx-2, COX-2 and cyclin D1 mRNA levels were assessed by qPCR. Ribosomal 18S RNA was used as an internal control. Relative Units (RU) reflect normalization to controls. Values are means of results obtained in three independent experiments. Statistically significant differences compared to mock-transfected controls are indicated (* p < 0.05). E: Cyclin D1, COX-2 and endogenous survivin protein levels were evaluated by western blotting, quantified by scanning densitometry of immunoblots and normalized to actin. Numerical data shown are means of results obtained in three independent experiments. Statistically significant differences compared to mock controls are indicated (* p < 0.05).
Figure 3
Figure 3
Survivin downregulation decreased β-catenin protein levels and β-catenin/Tcf-Lef transcriptional activity: A,B: B16F10 cells were stably transfected with 2 different shRNA targeting mouse survivin (shSUR1 and shSUR2) or luciferase (shLUC) as a control. Batch populations of cells (5×10⁵) were seeded in 6-wells plates A: After 24 h, β-catenin, COX-2, Cyclin D1, survivin, and actin protein levels were evaluated by western blotting. Protein levels were quantified by scanning densitometric analysis of western blots and normalized to actin. Numerical data shown are the means of results obtained in three independent experiments. Statistically significant differences compared to shLUC controls are indicated (* p < 0.05). B: B16F10 (shLUC, shSUR1 and shSUR2) cells were transiently transfected with the reporter plasmids pTOP-FLASH or pFOP-FLASH (1 μg). Luciferase activity was obtained by calculating the pTOP-FLASH/pFOP-FLASH activity ratios for each condition. Data were previously normalized to values for β-galactosidase activity. Numerical data shown are the means ± s.e.m. of results obtained in three independent experiments. Statistically significant differences between shSUR1-2 and shLUC controls are indicated (* p < 0.05).
Figure 4
Figure 4
Survivin effects on β-catenin protein levels and β-catenin/Tcf-Lef transcriptional activity were suppressed by inhibiting PI3K or Akt in HEK293T cells. A,B: HEK293T cells (5×10⁵) were seeded in 6-well plates and transfected with pEGFP-C1 or pEGFP-survivin (1.5 μg). After transfection, cells were treated with LY294002 (20 μM) or wortmannin (10 nM). After 24 h, β-catenin, survivin, Akt, p-Akt, GFP and actin protein levels were evaluated by western blotting. Protein levels were quantified by scanning densitometric analysis of western blots and normalized to actin. C: HEK293T cells were seeded (5×10⁵) in 6-wells plates and co-transfected with pcDNA or pcDNA-survivin (0.8 μg) and a dominant negative form (1 μg) of Akt (AktM). After 24 h, β-catenin, survivin, Akt, p-Akt and GAPDH protein levels were evaluated by western blotting. Protein levels were quantified by scanning densitometric analysis of western blots and normalized to GAPDH. D: HEK293T cells were seeded (5×10⁵) in 6-wells plates and co-transfected with pEGFP-C1 or pEGFP-survivin (1.5 μg) and the reporter plasmids pTOP-FLASH or pFOP-FLASH (1 μg). After transfection, cells were treated with LY294002 (20 μM). Luciferase activity was obtained by calculating the pTOP-FLASH/pFOP-FLASH activity ratio for each condition. Data were previously normalized to values for β-galactosidase activity. E: HEK293T cells were seeded (5×10⁵) in 6-well plates and transiently cotransfected with pcDNA or pcDNA-survivin (0.8 μg), the reporter plasmids pTOP-FLASH or pFOP-FLASH (1 μg) and in some cases dominant negative Akt (AktM, 1 μg). Luciferase activity was obtained by calculating the pTOP-FLASH/pFOP-FLASH activity ratio for each condition. Data were previously normalized to values for β-galactosidase activity. Numerical data shown are the means ± s.e.m. of results obtained in three independent experiments. Statistically significant differences compared to mock controls are indicated (* p < 0.05).
Figure 5
Figure 5
Survivin expression increased VEGF mRNA and VEGF protein levels in the medium: A,B: HEK293T cells (5×10 5 ) were seeded in 6-well plates and transfected with pEGFP-C1 or pEGFP-survivin (1.5 μg). A: After 24 h, VEGF (VEGF165 and VEGF121) and survivin mRNA levels were assessed by semi-quantitative RT-PCR. Actin was used as internal control. B: Total VEGF mRNA levels were assessed by qPCR. Ribosomal 18S RNA was used as internal control. C,D Extracellular VEGF was determined by an ELISA assay of supernatants from HEK293T (C) or MKN45 cells (D) transfected with pEGFP-C1 or pEGFP-survivin. Numerical data shown are the means ± s.e.m. of total VEGF measured in culture supernatants obtained in three independent experiments. Statistically significant differences compared to mock controls are indicated (* P < 0.05).
Figure 6
Figure 6
Angiogenesis and VEGF expression were reduced in tumors derived from survivin-down regulated B16F10 cells: A,B: B16F10 cells stably transfected with shLUC or shSUR2 were used (see Figure 3 ). Cells (3 × 10⁵) were subcutaneously injected in 8–10 week-old C57BL6 mice (6 mice per treatment). Once the tumors reached a volume of approximately 1500mm3 mice were sacrificed, tumors extracted, measured, divided in halves and formalin-fixed for 24 h. After that samples were paraffin-included, sectioned and then slices were de-paraffined and hydrated. A: Samples were stained with arteta, which allows direct visualization of blood vessels. The left panel shows a representative section of a tumor derived from shLUC transfected cells, the center panel, a tumor derived from shSUR2 transfected cells and the right panel, the quantification of average blood vessel density (10 fields per mouse, total 60 fields, * p < 0.05). B: samples were analyzed by immunohistochemistry with anti-VEGF specific antibodies. The left panel shows a representative section of a tumor derived from shLUC transfected cells, the center panel, a tumor derived from shSUR2 transfected cells and the right panel depicts the VEGF-Expression Level Score (ELS) obtained as described in Material & Methods for both conditions (10 samples each condition, * p < 0.05). Magnification bar = 100 μm.
Figure 7
Figure 7
Survivin expression augmented VEGF-dependent angiogenesis in the chick-CAM assay: A,B: HEK293T cells (2×10 6 ) were seeded in 60 mm plates, transfected with pEGFP-C1 or pEGFP-survivin (5μg) and after 48 h supernatants were collected and centrifuged. Also, cells in suspension were obtained (106/mL). The solutions, fresh medium alone, or media obtained from non-transfected cells or cells in suspension, were pipetted onto chick chorioallantoic membranes (CAM) as described in Materials and Methods. Per condition 3 eggs were employed. A week later CAMs were fixed and stained with hematoxilin-eosin. Three sections per egg were analyzed. A: Vessels (arrows) were photographed and counted (10 photographs per section). B: The number of vessels per mm2 optic field (mean ± s.e.m., n = 3, *: p < 0.05) are depicted. C: Supernatants of pEGFP-C1 and pEGFP-survivin obtained as described (A,B), were treated with increasing concentrations of anti-VEGF neutralizing antibodies (0.1, 1, 10 μg/mL). As an IgG control, anti-β3 integrin was used at the highest concentration (10 μg/mL). Numerical data shown are the means ± s.e.m. of results obtained in three independent experiments. Statistically significant differences compared to mock controls are indicated (* = p < 0.05). D: Model: β-catenin translocates to the nucleus where it binds Tcf/Lef and induces the expression of target genes (survivin, vegf, cox-2 are depicted). Survivin (by unknown mechanisms) favors PI3K/Akt activation, which increases β-catenin-Tcf/Lef transcriptional activity, thereby promoting its own expression (feeding this positive feedback loop), as well as that of cox-2 and vegf. The protein VEGF is secreted to the extracellular compartment where it induces angiogenesis.

Similar articles

Cited by

References

    1. Folkman J. Tumor angiogenesis: therapeutic implications. N Engl J Med. 1971;285:1182–1186. doi: 10.1056/NEJM197108122850711. - DOI - PubMed
    1. Fox SB, Gatter KC, Harris AL. Tumour angiogenesis. J Pathol. 1996;179:232–237. doi: 10.1002/(SICI)1096-9896(199607)179:3<232::AID-PATH505>3.0.CO;2-A. - DOI - PubMed
    1. Hicklin DJ, Ellis LM. Role of the vascular endothelial growth factor pathway in tumor growth and angiogenesis. J Clin Oncol. 2005;23:1011–1027. doi: 10.1200/JCO.2005.06.081. - DOI - PubMed
    1. Altieri DC. Survivin, cancer networks and pathway-directed drug discovery. Nat Rev Cancer. 2008;8:61–70. doi: 10.1038/nrc2293. - DOI - PubMed
    1. Kelly RJ, Lopez-Chavez A, Citrin D, Janik JE, Morris JC. Impacting tumor cell-fate by targeting the inhibitor of apoptosis protein survivin. Mol Cancer. 2011;10:35. doi: 10.1186/1476-4598-10-35. - DOI - PMC - PubMed

Publication types

MeSH terms