Clinical Trial
. 2015 Jan;9(1):204-17.
doi: 10.1016/j.molonc.2014.08.001. Epub 2014 Aug 27.

Targeting BRCA1-BER deficient breast cancer by ATM or DNA-PKcs blockade either alone or in combination with cisplatin for personalized therapy

Affiliations
Clinical Trial

Targeting BRCA1-BER deficient breast cancer by ATM or DNA-PKcs blockade either alone or in combination with cisplatin for personalized therapy

Nada Albarakati et al. Mol Oncol. 2015 Jan.

Abstract

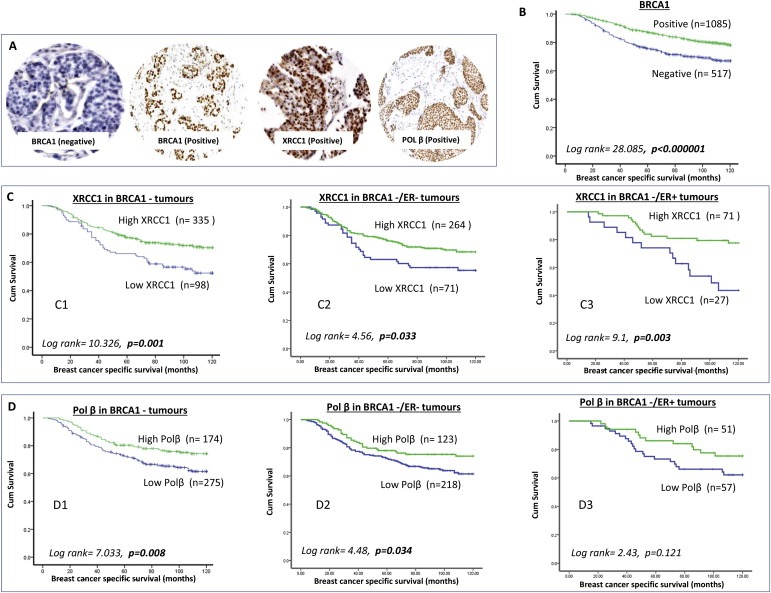
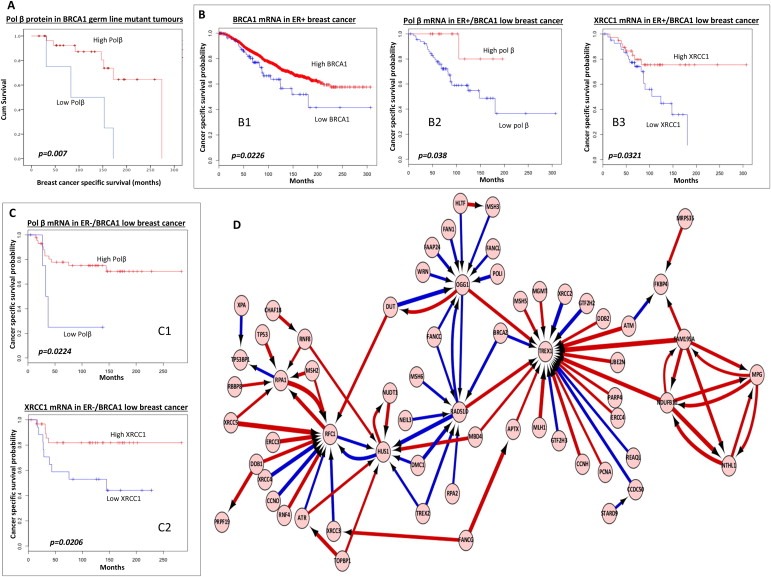
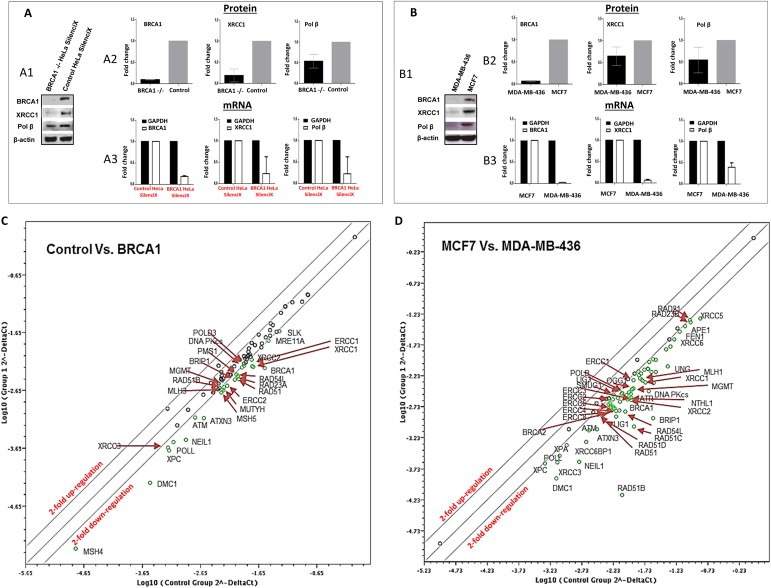
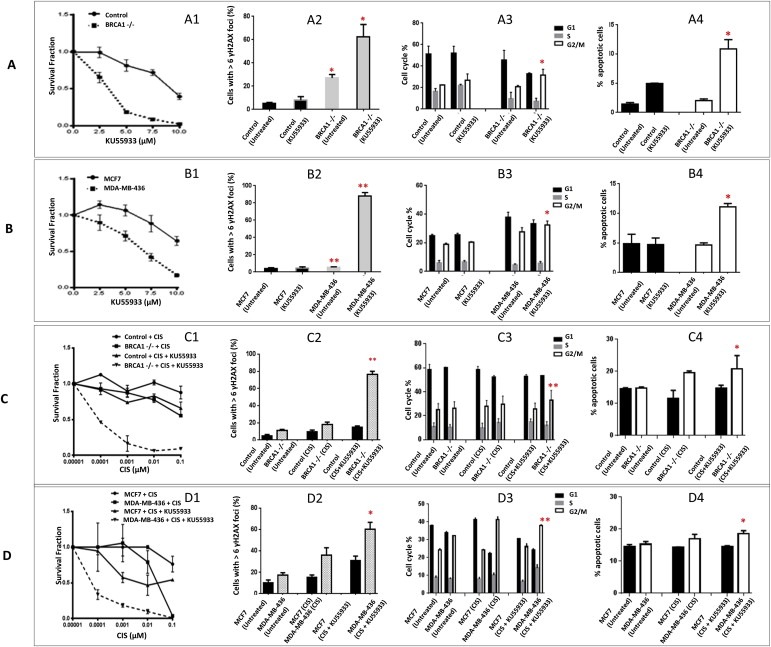
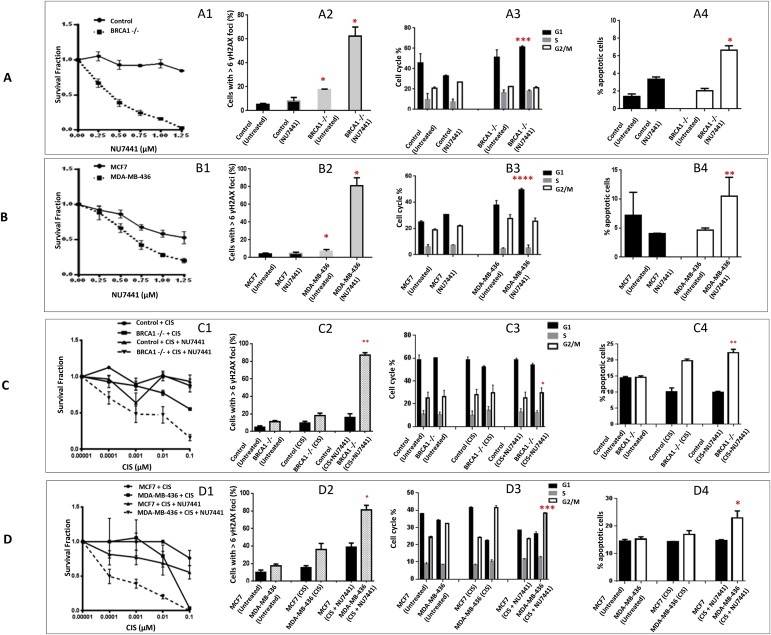
BRCA1, a key factor in homologous recombination (HR) repair may also regulate base excision repair (BER). Targeting BRCA1-BER deficient cells by blockade of ATM and DNA-PKcs could be a promising strategy in breast cancer. We investigated BRCA1, XRCC1 and pol β protein expression in two cohorts (n = 1602 sporadic and n = 50 germ-line BRCA1 mutated) and mRNA expression in two cohorts (n = 1952 and n = 249). Artificial neural network analysis for BRCA1-DNA repair interacting genes was conducted in 249 tumours. Pre-clinically, BRCA1 proficient and deficient cells were DNA repair expression profiled and evaluated for synthetic lethality using ATM and DNA-PKcs inhibitors either alone or in combination with cisplatin. In human tumours, BRCA1 negativity was strongly associated with low XRCC1, and low pol β at mRNA and protein levels (p < 0.0001). In patients with BRCA1 negative tumours, low XRCC1 or low pol β expression was significantly associated with poor survival in univariate and multivariate analysis compared to high XRCC1 or high pol β expressing BRCA1 negative tumours (ps < 0.05). Pre-clinically, BRCA1 negative cancer cells exhibit low mRNA and low protein expression of XRCC1 and pol β. BRCA1-BER deficient cells were sensitive to ATM and DNA-PKcs inhibitor treatment either alone or in combination with cisplatin and synthetic lethality was evidenced by DNA double strand breaks accumulation, cell cycle arrest and apoptosis. We conclude that XRCC1 and pol β expression status in BRCA1 negative tumours may have prognostic significance. BRCA1-BER deficient cells could be targeted by ATM or DNA-PKcs inhibitors for personalized therapy.

Keywords: ATM; BRCA1; Base excision repair; Chemopotentiation; Cisplatin; DNA-PK; Small molecule inhibitors; Synthetic lethality.


Figures

Figure 1
Figure 1
BRCA1 and BER protein expression in human breast cancer. A. Microphotographs of BRCA1 negative, BRCA1 positive, pol β positive and XRCC1 positive breast cancers. B. Kaplan–Meier curves showing breast cancer specific survival (BCSS) in patients based on BRCA1 expression status. C1. Kaplan–Meier curves showing breast cancer specific survival (BCSS) in patients with BRCA1 negative tumours based on XRCC1 expression status. C2. Kaplan–Meier curves showing breast cancer specific survival (BCSS) in patients with BRCA1 negative/ER negative tumours based on XRCC1 expression status. C3. Kaplan–Meier curves showing breast cancer specific survival (BCSS) in patients with BRCA1 negative/ER positive tumours based on XRCC1 expression status. D1. Kaplan–Meier curves showing breast cancer specific survival (BCSS) in patients with BRCA1 negative tumours based on pol β expression status. D2. Kaplan–Meier curves showing breast cancer specific survival (BCSS) in patients with BRCA1 negative/ER negative tumours based on pol β expression status. D3. Kaplan–Meier curves showing breast cancer specific survival (BCSS) in patients with BRCA1 negative/ER positive tumours based on pol β expression status.
Figure 2
Figure 2
A. Kaplan–Meier curves showing overall survival in patients with germ‐line BRCA1mutated tumours based on pol β protein expression status. B1. Kaplan–Meier curves showing breast cancer specific survival (BCSS) in patients based on BRCA1 mRNA expression status in ER+ breast cancer (METABRIC cohort). B2. Kaplan–Meier curves showing breast cancer specific survival (BCSS) in patients with BRCA1 mRNA low/ER+ who received adjuvant endocrine therapy based on pol β mRNA status (METABRIC cohort). B3. Kaplan–Meier curves showing breast cancer specific survival (BCSS) in patients with BRCA1 mRNA low/ER+ who received adjuvant endocrine therapy based on XRCC1 mRNA status (METABRIC cohort). C1. Kaplan–Meier curves showing breast cancer specific survival (BCSS) in patients with BRCA1 mRNA low/ER‐who received adjuvant chemotherapy based on pol β mRNA status (METABRIC cohort). C2. Kaplan–Meier curves showing breast cancer specific survival (BCSS) in patients with BRCA1 mRNA low/ER‐who received adjuvant chemotherapy based on XRCC1 mRNA status (METABRIC cohort). D. The neural network illustrates the top genes that interact with BRCA1 and other DNA repair genes. In addition, the artificial neural network also reveals how these top genes interact with each other. Top pair‐wise interactions for gene probe markers associated with BRCA1 expression and the DNA repair process in 249 breast cancers is shown here. Each gene probe is represented by a node and the interaction weight between them as an edge, the width being defined by the magnitude of the weight. Interactions are directed from a source gene to a target gene as indicated by arrows. Red interactions indicate an excitatory interaction and blue indicates an inhibitory interaction. Highly linked genes represent hubs that are indicated to be highly influential or highly regulated in the BRCA1‐DNA repair system. See supplementary data S12 for the biological functions of individual genes.
Figure 3
Figure 3
DNA repair expression in BRCA1 deficient and BRCA1 proficient cells A1. Representative Western blots of BRCA1, XRCC1 and pol β in BRCA1 deficient HeLa SilenciX cells and control BRCA1 proficient HeLa SilenciX cells. A2. Protein quantification in BRCA1 deficient HeLa SilenciX cells and control BRCA1 proficient HeLa SilenciX cells are shown here. The Figure shows fold change in BRCA1 deficient cells in comparison to BRCA1 proficient cells. A3. mRNA expression in BRCA1 deficient HeLa SilenciX cells and control BRCA1 proficient HeLa SilenciX cells are shown here. The Figure shows fold change in BRCA1 deficient cells in comparison to BRCA1 proficient cells. B1. Representative Western blots of BRCA1, XRCC1 and pol β in BRCA1 deficient MDA‐MB‐436 cells and BRCA1 proficient MCF7 cells. B2. Protein quantification in MDA‐MB‐436 cells and MCF7 cells are shown here. The Figure shows fold change in BRCA1 deficient cells in comparison to BRCA1 proficient cells. B3. mRNA expression in MDA‐MB‐436 cells and MCF7 cells are shown here. The Figure shows fold change in BRCA1 deficient cells in comparison to BRCA proficient cells. C. Scatter plots indicate up‐ and down‐regulation of DNA repair mRNA expression in BRCA1 deficient HeLa SilenciX cells compared to BRCA1 proficient HeLa SilenciX cells. D. Scatter plots indicate up‐ and down‐regulation of DNA repair mRNA expression in MDA‐MB‐436 cells compared to MCF7 cells are shown here. Green circles show genes that are two‐fold or more down‐regulated. See also Results section and Supplementary Tables S16 and S17.
Figure 4
Figure 4
ATM inhibitors in BRCA1 deficient and BRCA1 proficient cells. A1. Clonogenic survival assays in BRCA1 deficient HeLa SilenciX cells and control BRCA1 proficient HeLa SilenciX cells treated with KU55933. A2. ↠H2AX immunohistochemistry in BRCA1 deficient HeLa SilenciX cells and control BRCA1 proficient HeLa SilenciX cells treated with KU55933. A3. FACS analysis in BRCA1 deficient HeLa SilenciX cells and control BRCA1 proficient HeLa SilenciX cells treated with KU55933. A4. Annexin V flow cytometric analysis in BRCA1 deficient HeLa SilenciX cells and control BRCA1 proficient HeLa SilenciX cells treated with KU55933.B1. Clonogenic survival assays in MDA‐MB‐436 and MCF7 cells treated with KU55933. B2. ↠H2AX immunohistochemistry in MDA‐MB‐436 and MCF7 cells treated with KU55933. B3. FACS analysis in MDA‐MB‐436 and MCF7 cells treated with KU55933. B4. Annexin V flow cytometric analysis in MDA‐MB‐436 and MCF7 cells treated with KU55933. Inhibitors were added at the indicated concentrations (see Methods for details). C1. Clonogenic survival assays in BRCA1 deficient HeLa SilenciX cells and control BRCA1 proficient HeLa SilenciX cells treated with cisplatin alone or in combination with KU55933. C2. ↠H2AX immunohistochemistry in BRCA1 deficient HeLa SilenciX cells and control BRCA1 proficient HeLa SilenciX cells treated with cisplatin alone or in combination with KU55933. C3. FACS analysis in BRCA1 deficient HeLa SilenciX cells and control BRCA1 proficient HeLa SilenciX cells treated with cisplatin alone or in combination with KU55933. C4. Annexin V flow cytometric analysis in BRCA1 deficient HeLa SilenciX cells and control BRCA1 proficient HeLa SilenciX cells treated with cisplatin alone or in combination with KU55933. D1. Clonogenic survival assays in MDA‐MB‐436 and MCF7 cells treated with cisplatin alone or in combination with KU55933. D2. ↠H2AX immunohistochemistry in MDA‐MB‐436 and MCF7 cells treated with cisplatin alone or in combination with KU55933. D3. FACS analysis in MDA‐MB‐436 and MCF7 cells treated with cisplatin alone or in combination with KU55933. D4. Annexin V flow cytometric analysis in MDA‐MB‐436 and MCF7 cells treated with cisplatin alone or in combination with KU55933. *p < 0.05, **p < 0.01.
Figure 5
Figure 5
DNA‐PKcs inhibitors in BRCA1 deficient and BRCA1 proficient cells. A1. Clonogenic survival assays in BRCA1 deficient HeLa SilenciX cells and control BRCA1 proficient HeLa SilenciX cells treated with NU7441. A2. ↠H2AX immunohistochemistry in BRCA1 deficient HeLa SilenciX cells and control BRCA1 proficient HeLa SilenciX cells treated with NU7441. A3. FACS analysis in BRCA1 deficient HeLa SilenciX cells and control BRCA1 proficient HeLa SilenciX cells treated with NU7441. A4. Annexin V flow cytometric analysis in BRCA1 deficient HeLa SilenciX cells and control BRCA1 proficient HeLa SilenciX cells treated with NU7441.B1. Clonogenic survival assays in MDA‐MB‐436 and MCF7 cells treated with NU7441. B2. ↠H2AX immunohistochemistry in MDA‐MB‐436 and MCF7 cells treated with NU7441. B3. FACS analysis in MDA‐MB‐436 and MCF7 cells treated with NU7441. B4. Annexin V flow cytometric analysis in MDA‐MB‐436 and MCF7 cells treated with NU7441. Inhibitors were added at the indicated concentrations (see Methods for details). C1. Clonogenic survival assays in BRCA1 deficient HeLa SilenciX cells and control BRCA1 proficient HeLa SilenciX cells treated with cisplatin alone or in combination with NU7441. C2. ↠H2AX immunohistochemistry in BRCA1 deficient HeLa SilenciX cells and control BRCA1 proficient HeLa SilenciX cells treated with cisplatin alone or in combination with NU7441. C3. FACS analysis in BRCA1 deficient HeLa SilenciX cells and control BRCA1 proficient HeLa SilenciX cells treated with cisplatin alone or in combination with NU7441. C4. Annexin V flow cytometric analysis in BRCA1 deficient HeLa SilenciX cells and control BRCA1 proficient HeLa SilenciX cells treated with cisplatin alone or in combination with NU7441. D1. Clonogenic survival assays in MDA‐MB‐436 and MCF7 cells treated with cisplatin alone or in combination with NU7441. D2. ↠H2AX immunohistochemistry in MDA‐MB‐436 and MCF7 cells treated with cisplatin alone or in combination with NU7441. D3. FACS analysis in MDA‐MB‐436 and MCF7 cells treated with cisplatin alone or in combination with NU7441. D4. Annexin V flow cytometric analysis in MDA‐MB‐436 and MCF7 cells treated with cisplatin alone or in combination with NU7441. *p < 0.05, **p < 0.01.

References

    1. Abdel-Fatah, T. , Sultana, R. , Abbotts, R. , Hawkes, C. , Seedhouse, C. , Chan, S. , Madhusudan, S. , 2013. Clinicopathological and functional significance of XRCC1 expression in ovarian cancer. Int. J. Cancer J. Int. du Cancer. 132, 2778–2786. - PubMed
    1. Abdel-Fatah, T.M. , Albarakati, N. , Bowell, L. , Agarwal, D. , Moseley, P. , Hawkes, C. , Ball, G. , Chan, S. , Ellis, I.O. , Madhusudan, S. , 2013. Single-strand selective monofunctional uracil-DNA glycosylase (SMUG1) deficiency is linked to aggressive breast cancer and predicts response to adjuvant therapy. Breast Cancer Res. Treat. 142, 515–527. - PubMed
    1. Abdel-Fatah, T.M. , Perry, C. , Moseley, P. , Johnson, K. , Arora, A. , Chan, S. , Ellis, I.O. , Madhusudan, S. , 2014. Clinicopathological significance of human apurinic/apyrimidinic endonuclease 1 (APE1) expression in oestrogen-receptor-positive breast cancer. Breast Cancer Res. Treat. 143, 411–421. - PubMed
    1. Abdel-Fatah, T.M. , Russell, R. , Agarwal, D. , Moseley, P. , Abayomi, M.A. , Perry, C. , Albarakati, N. , Ball, G. , Chan, S. , Caldas, C. , Ellis, I.O. , Madhusudan, S. , 2014. DNA polymerase beta deficiency is linked to aggressive breast cancer: a comprehensive analysis of gene copy number, mRNA and protein expression in multiple cohorts. Mol. Oncol. 8, 520–532. - PMC - PubMed
    1. Abdel-Fatah, T.M. , Russell, R. , Albarakati, N. , Maloney, D.J. , Dorjsuren, D. , Rueda, O.M. , Moseley, P. , Mohan, V. , Sun, H. , Abbotts, R. , Mukherjee, A. , Agarwal, D. , Illuzzi, J.L. , Jadhav, A. , Simeonov, A. , Ball, G. , Chan, S. , Caldas, C. , Ellis, I.O. , Wilson, D.M. , Madhusudan, S. , 2014. Genomic and protein expression analysis reveals flap endonuclease 1 (FEN1) as a key biomarker in breast and ovarian cancer. Mol. Oncol. 10.1016/j.molonc.2014.04.009 pii: S1574-7891(14)00092-1 - DOI - PMC - PubMed

MeSH terms