. 2014 Nov 1;74(21):6048-59.
doi: 10.1158/0008-5472.CAN-14-1450. Epub 2014 Sep 9.

Reducing CD73 expression by IL1β-Programmed Th17 cells improves immunotherapeutic control of tumors

Affiliations

Reducing CD73 expression by IL1β-Programmed Th17 cells improves immunotherapeutic control of tumors

Shilpak Chatterjee et al. Cancer Res. .

Abstract

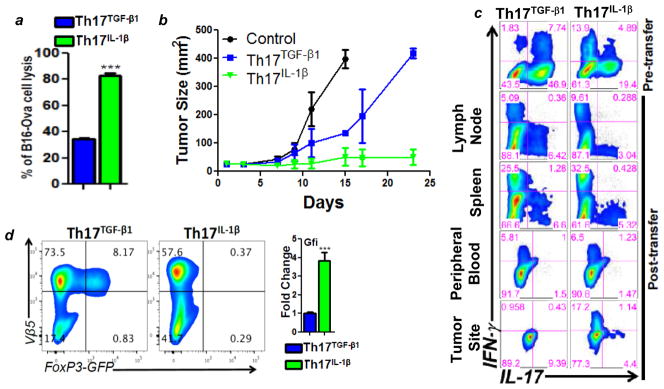
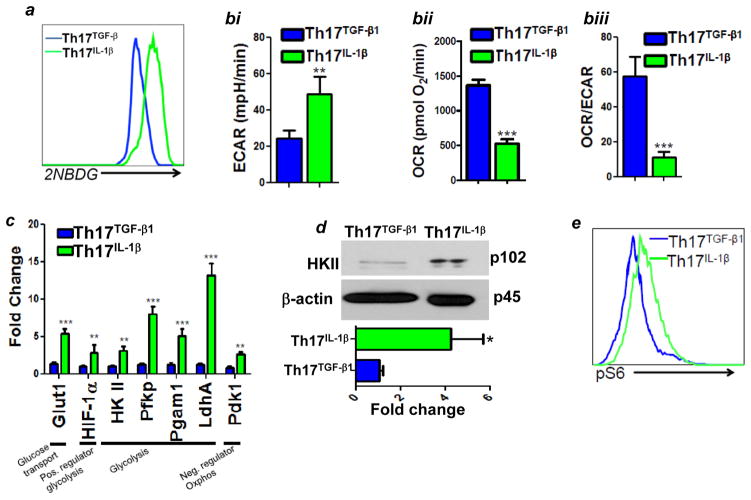
T cells of the T helper (Th)17 subset offer promise in adoptive T-cell therapy for cancer. However, current protocols for ex vivo programming of Th17 cells, which include TGFβ exposure, increase the expression of CD39 and CD73, two cell surface ATP ectonucleotidases that reduce T-cell effector functions and promote immunosuppression. Here, we report that ATP-mediated suppression of IFNγ production by Th17 cells can be overcome by genetic ablation of CD73 or by using IL1β instead of TGFβ to program Th17 cells ex vivo. Th17 cells cultured in IL1β were also highly polyfunctional, expressing high levels of effector molecules and exhibiting superior short-term control of melanoma in mice, despite reduced stem cell-like properties. TGFβ addition at low doses that did not upregulate CD73 expression but induced stemness properties drastically improved the antitumor effects of IL1β-cultured Th17 cells. Effector properties of IL1β-dependent Th17 cells were likely related to their high glycolytic capacity, since ex vivo programming in pyruvate impaired glycolysis and antitumor effects. Overall, we show that including TGFβ in ex vivo cultures used to program Th17 cells blunts their immunotherapeutic potential and demonstrate how this potential can be more fully realized for adoptive T-cell therapy.


Conflict of interest statement

Conflict of Interest: The authors state no conflict of interest.

Figures

Figure 1
Figure 1. TGF-β induced CD73 expression on Th17 cells increases susceptibility for IFN-γ suppression
(a) Flow cytometric analysis of ectonucleotidases (CD39 and CD73) expression by unpolarized (Th0) or TGF-β1 mediated Th17 (Th17TGF-β1) cells. Data are representative of 5 independent experiments. (b–d) Intracellular IFN-γ and IL-17 production in: (b) presence or absence of ATP (50 μM) by Th17TGF-β1 or unpolarized (Th0) cells, (c) Thy1.1+ Th17TGF-β1 cells retrieved from the tumor site of C57BL/6 (Thy1.2+) mice (n=4) bearing EL-4 ascetic tumor following 48 h of T cells transfer, (d) Th17TGF-β1 polarized cells from either wt. or CD73−/− C57BL/6 mice. Cumulative data from 3 different experiments is represented in bar diagram alongside dot-plot for the percentage of cells producing IFN-γ in presence or absence of ATP (50 μM). (e) Flow cytometric analysis (right panel) of CD39 and CD73 expression by Th0, Th17TGF-β1 and Th17IL-1β cells. (f–g) intracellular IFN-γ and IL-17 secretion in: (f) presence or absence of ATP by Th17IL-1β cells, (g) Thy1.1+ Th17IL-1β cells retrieved from the tumor site of C57BL/6 (Thy1.2+) mice (n=4) bearing EL-4 ascetic tumor following 48 h of T cells transfer. Results are representative of 3 (e) and 5 (f–g) independent experiments. ***p<0.0001.
Figure 2
Figure 2. Distinct functionality of Th17TGF-β1 and Th17IL-1β cells
(a) Naïve CD4+ T cells from C57BL/6 mice were differentiated towards either Th17TGF-β1 or Th17IL-1β and intracellular production of various cytokines was analyzed. Percentage of cells producing different cytokines is also represented in pi-diagram (50,000 cells/group were analyzed to draw pi-diagram). (b) q-PCR analysis (upper panel) and flow cytometric analysis (lower panel) of various Th17 signature transcription factors expression by Th17TGF-β1 and Th17IL-1β cells. (c–d) Flow cytometric analysis of: (ci) CD62L vs. CD44 expression, and (cii) CD25 expression Th17TGF-β1 and Th17IL-1β cells at day 3 of polarization. (di) q-PCR analysis of expression of key effector genes in Th17TGF-β1 and Th17IL-1β cells after 3 days of polarization. Transcription factors array (dii) and signal transduction array (diii), was performed using the 84-gene q-PCR based array kit (SABiosciences, Valencia, CA, USA) as per manufacturer’s recommendation. Fold up-regulation (blue) or down-regulation (red) of Th17IL-1β over Th17TGF-β1.
Figure 3
Figure 3. Enhanced anti-tumor function of Th17IL-1β vs. Th17TGF-β1 cells
(a). B16-F10-ova cells labeled with CFSE were co-cultured at 1:5 ratio with either Th17TGF-β1 or Th17IL-1β for 6h and decrease in the number of cells expressing CFSE was analyzed by using flow cytometry. (b) wild type (WT) C57BL/6 mice (n=5 mice/group) were inoculated (s.c.) with 0.25×10⁶ B16-F10-ova murine melanoma cells and treated with cyclophosphamide (CTX) (4mg/mouse) after 7 days. CTX treated mice either kept untreated as control or adoptively transferred one day later with either 1×10⁶ ova specific Th17TGF-β1 or Th17IL-1β cells. Tumor growth was measured using digital calipers every fourth day. Data in figure demonstrate mean tumor size at each time point from one of the two experiments with similar results. (c) Intracellular cytokine production of ova specific donor Th17TGF-β1 and Th17IL-1β cells after retrieving from either lymph nodes, spleen, peripheral blood or tumor site of 21 days tumor bearing mice (n=4). Cytokines production of donor cells was compared with non-transferred cells. Data represent two independent experiments. (d) Naïve CD4+ T cells from OT-II GFP-FoxP3 mice were polarized to Th17TGF-β1 and Th17IL-1β type in presence of ova and percentage of cells expressing GFP (indicative of FoxP3 expressing cells) were analyzed after 3 days of polarization using flow cytometer (left panel). q-PCR analysis (right panel) of Gfi-1 expression by Th17TGF-β1 and Th17IL-1β cells. Data represent 3 independent experiments. **p< 0.005 and ***p<0.0001.
Figure 4
Figure 4. Th17TGF-β1 and Th17IL-1β cells are metabolically different
Differences in glycolysis between Th17TGF-β1 and Th17IL-1β cells was observed using: (a) Glucose uptake using fluorescent glucose (2-NBDG), (bi) Basal Extracellular Acidification Rate (ECAR), (bii) Basal Oxygen Consumption rate (OCR), (biii) Basal OCR/ECAR ratio, (c) q-PCR analysis of the expression of key genes associated with glycolysis, (d) Upper panel shows western blot for hexokinase II (HKII); lower panel: blot quantification of HKII, and (e) flow cytometric analysis of phosphorylation of S6 (pS6) ribosomal protein. Results in (a, b) are representative of 4 and (c, d) are representative of 3 independent experiments with similar results.
Figure 5
Figure 5. Shift from glycolysis dampens Th17IL-1β cells effector functions
(ai) Schematic diagram of the culture conditions used to generate the Th17IL-1β cells. (aii) Intracellular staining of various cytokines, (b) q-PCR analysis of the expression of key effector genes, and (c) cytolysis of B16-F10-ova cells was evaluated using Th17IL-1β cells polarized either in complete media (green bars) or in 20mM pyruvate (no glucose) containing media (brown bars). (d) C57BL/6 Rag1−/− mice (n=5 mice/group) were inoculated (s.c.) with 0.25 × 10⁶ B16-F10-ova, and after seven days mice were either kept untreated as control or adoptively transferred with either 1 × 10⁶ ova specific Th17IL-1β OT-II cells polarized either in complete media or 20mM pyruvate (no glucose) containing media. Tumor growth was measured using digital calipers every fourth day. Data in figure demonstrate mean tumor size at each time point in one of the two experiments with similar results. *p<0.05, **p< 0.005 and ***p<0.0001.
Figure 6
Figure 6. Low dose of TGF-β induces stem cell-like phenotype in Th17IL-1β cells
(a) q-PCR analysis for expression of key memory and stemness associated genes in Th17TGF-β1 and Th17IL-1β cells. Cumulative data from 3 independent experiments is presented. (b) Flow cytometric analysis for CD39 and CD73 expression on CD4 gated T cells after three days of culture in presence of various concentration of TGF-β. (c) q-PCR analysis of key glycolysis regulating genes (left panel), and memory/stemness associated genes (right panel) in either Th17TGF-β1, Th17IL-1β cells or Th17IL-1β cells cultured in presence of 250pg/ml TGF-β (i.e. Th17IL-1β+TGF-β cells). (d) OT-II CD4+ T cells were polarized towards different Th17 types and re-stimulated with either cognate antigen (ova323–339) or non-specific antigen (MART-1) for 4h. Cell death was determined by evaluating Annexin V vs. 7AAD by flow cytometry (left panel) as detailed in the supplementary method. Bar diagram (right panel) representing the percentage of Annexin V and 7AAD positive cells from three different experiments. (e) C57BL/6 Rag1−/− mice (n=4–5 mice/group) were inoculated (s.c.) with 0.25 × 10⁶ B16-F10-ova murine melanoma cells and after seven days mice either kept untreated as control or adoptively transferred with either 1 × 10⁶ ova specific Th17IL-1β or Th17IL-1β+TGF-β OT-II (Vβ5+CD4+) cells. Tumor growth was measured using digital calipers every fourth day. Data in figure demonstrate mean tumor size at each time point in one of the three experiments with similar results. (f) NSG-A2 mice (n=5 mice/group) were inoculated with 2.5 × 10⁶ HLA-A2+ human melanoma 624-MEL cells and after fifteen days mice were either kept untreated or treated with h3T mouse derived either 0.2 × 10⁶ human tyrosinase epitope reactive Th17TGF-β1 or Th17IL-1β+TGF-β cells. Tumor growth was measured using digital calipers every three day. Data in figure demonstrate mean tumor size at each time point. *p<0.05, **p< 0.005 and ***p<0.0001.

References

    1. Rosenberg SA. Raising the bar: the curative potential of human cancer immunotherapy. Sci Transl Med. 2012;4(127):127ps8. - PMC - PubMed
    1. Ngiow SF, Teng MW, Smyth MJ. Prospects for TIM3-Targeted Antitumor Immunotherapy. Cancer Res. 2011;71(21):6567–71. - PubMed
    1. Peggs KS, Quezada SA, Allison JP. Cancer immunotherapy: co-stimulatory agonists and co-inhibitory antagonists. Clinical and experimental immunology. 2009;157(1):9–19. - PMC - PubMed
    1. Klebanoff CA, Finkelstein SE, Surman DR, Lichtman MK, Gattinoni L, Theoret MR, et al. IL-15 enhances the in vivo antitumor activity of tumor-reactive CD8+ T cells. Proc Natl Acad Sci U S A. 2004;101(7):1969–74. - PMC - PubMed
    1. Muranski P, Boni A, Antony PA, Cassard L, Irvine KR, Kaiser A, et al. Tumor-specific Th17-polarized cells eradicate large established melanoma. Blood. 2008;112(2):362–73. - PMC - PubMed

Publication types

MeSH terms