. 2014 Oct 16;124(16):2533-43.
doi: 10.1182/blood-2014-01-553024. Epub 2014 Sep 9.

Role for early-differentiated natural killer cells in infectious mononucleosis

Affiliations

Role for early-differentiated natural killer cells in infectious mononucleosis

Tarik Azzi et al. Blood. .

Abstract

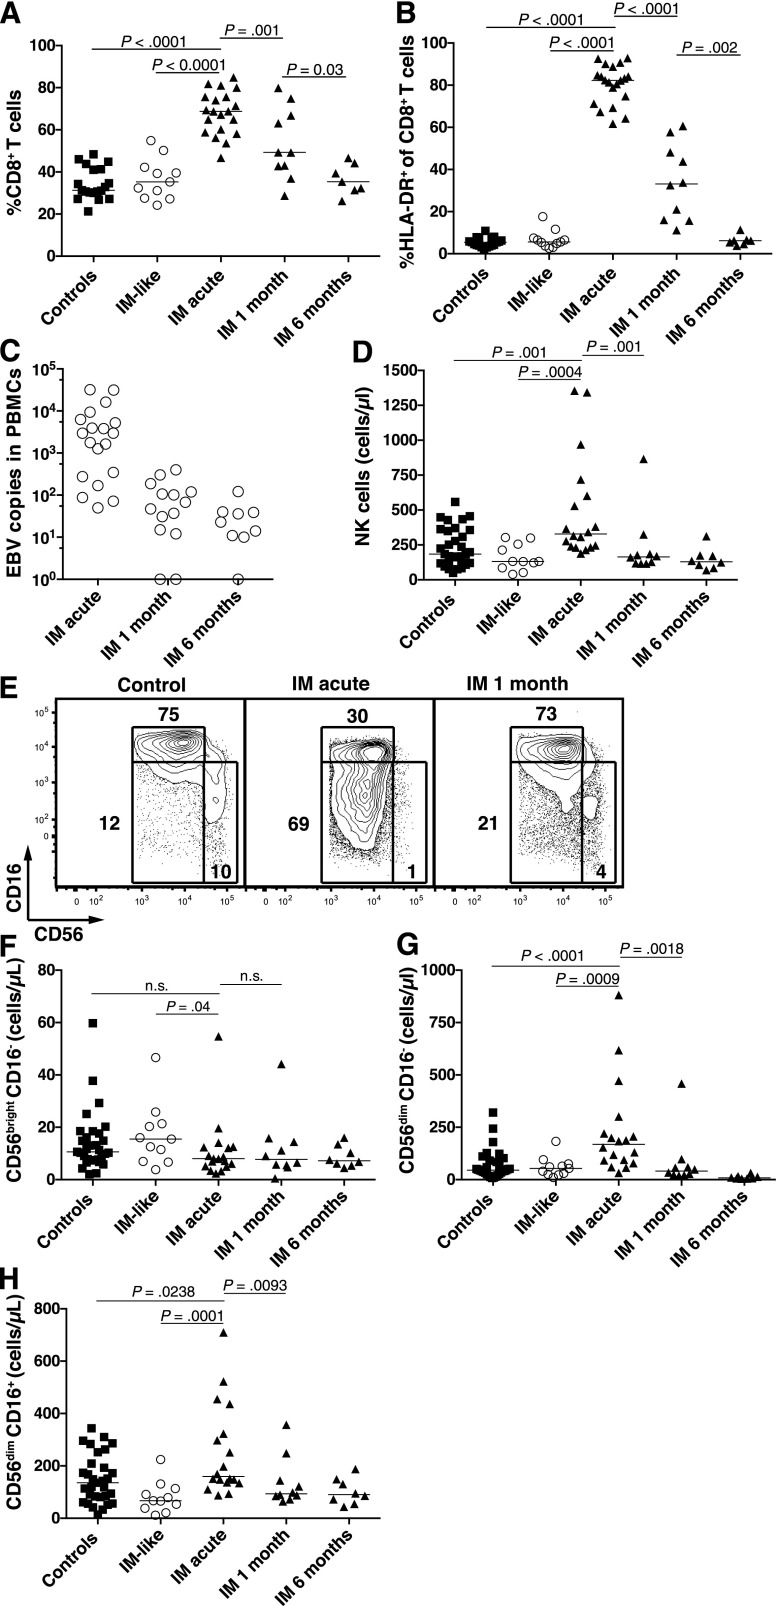
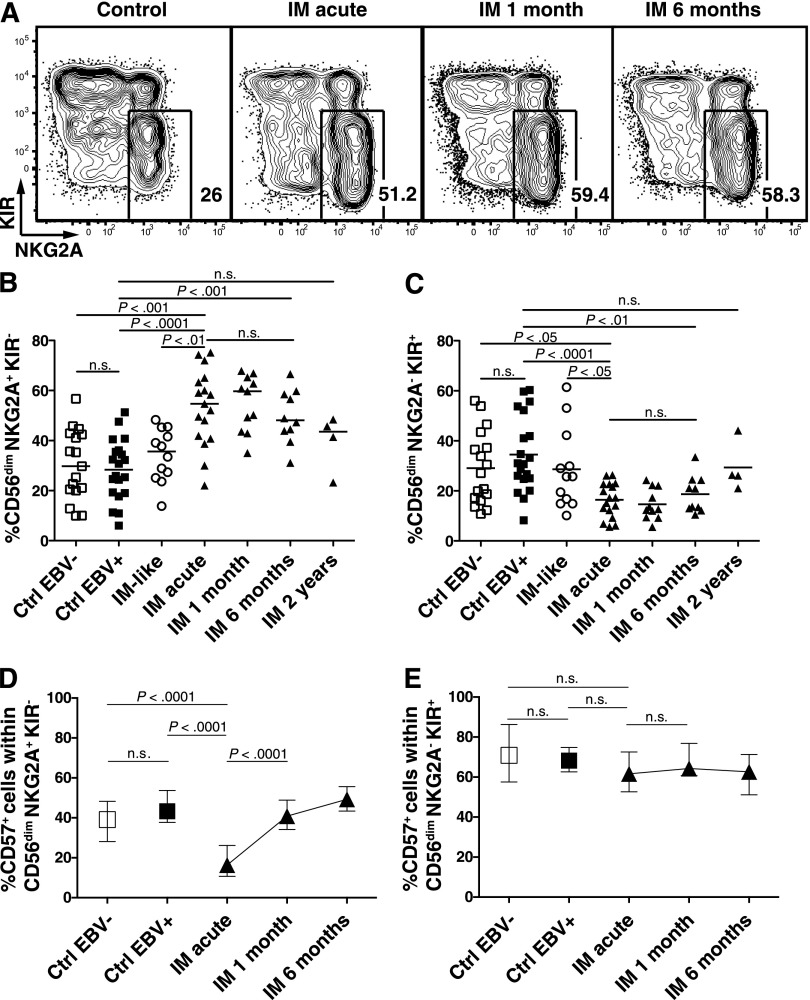
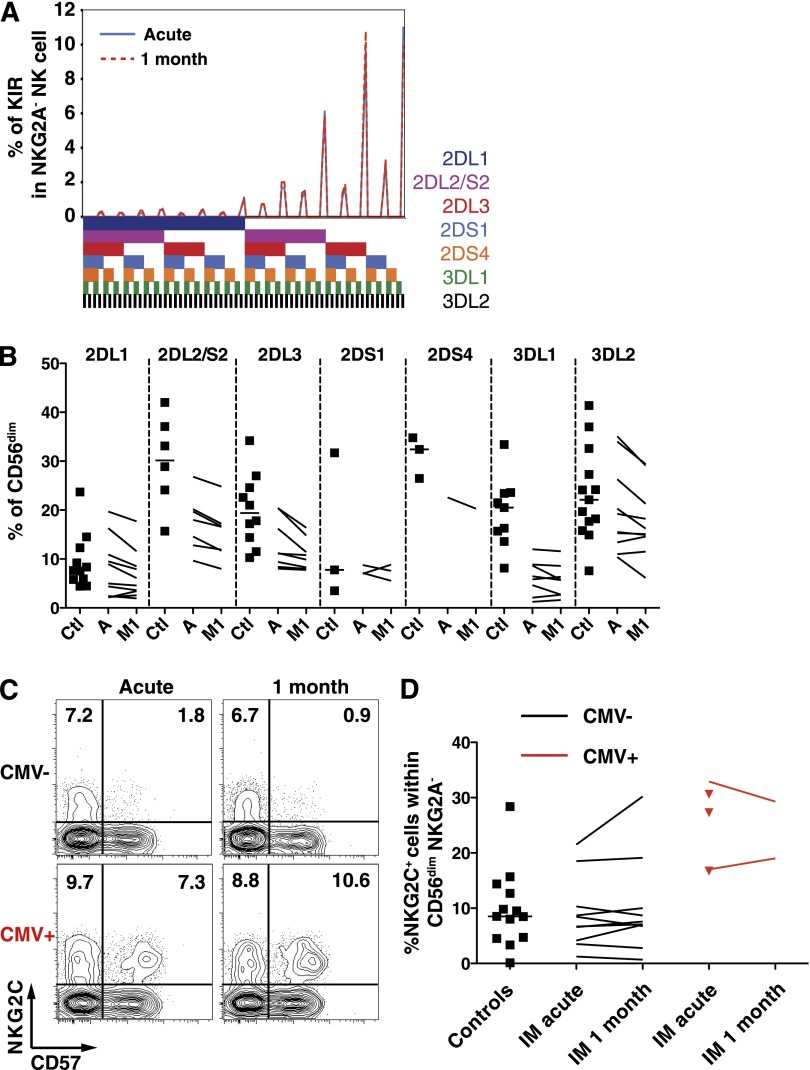
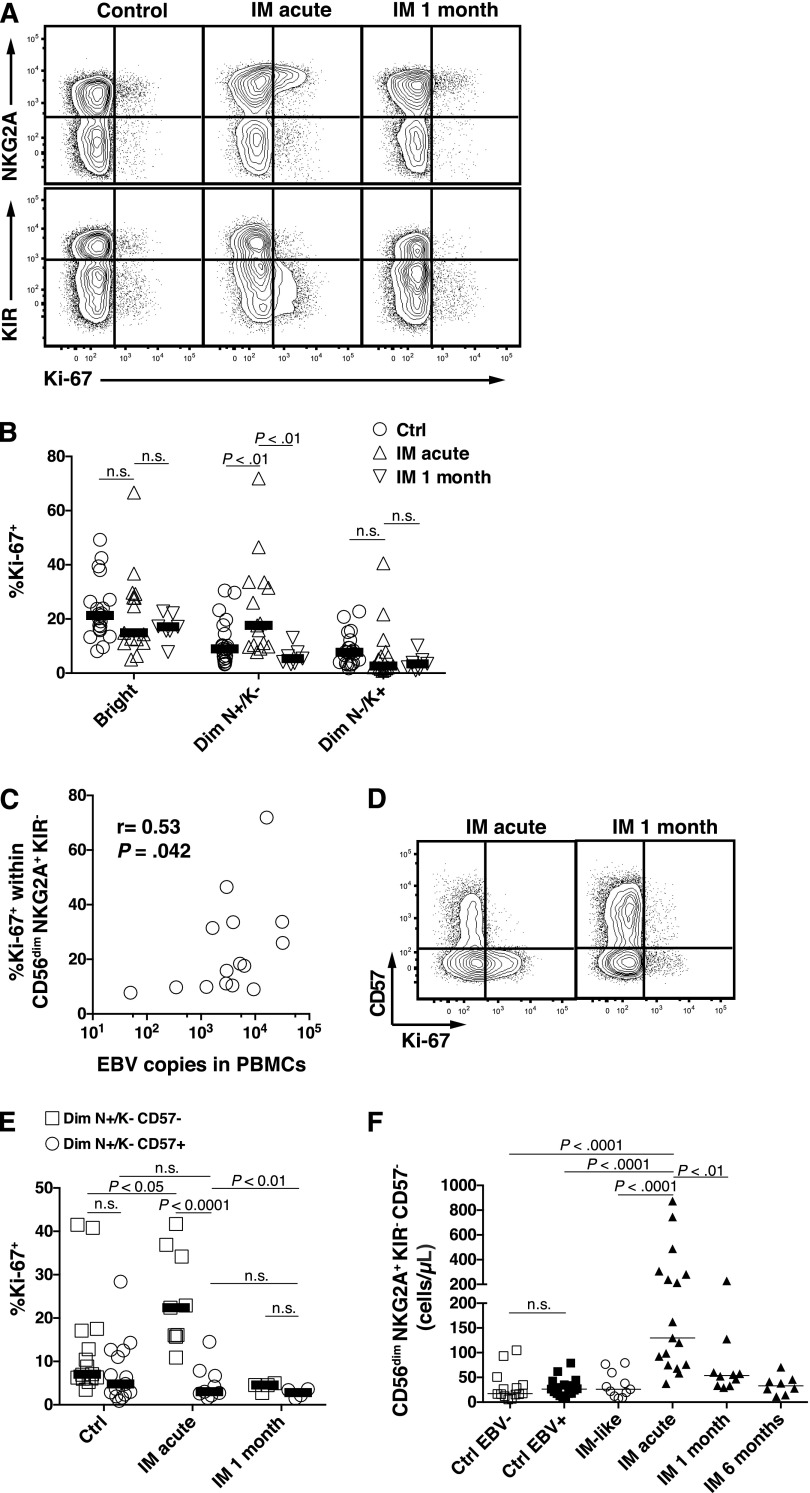
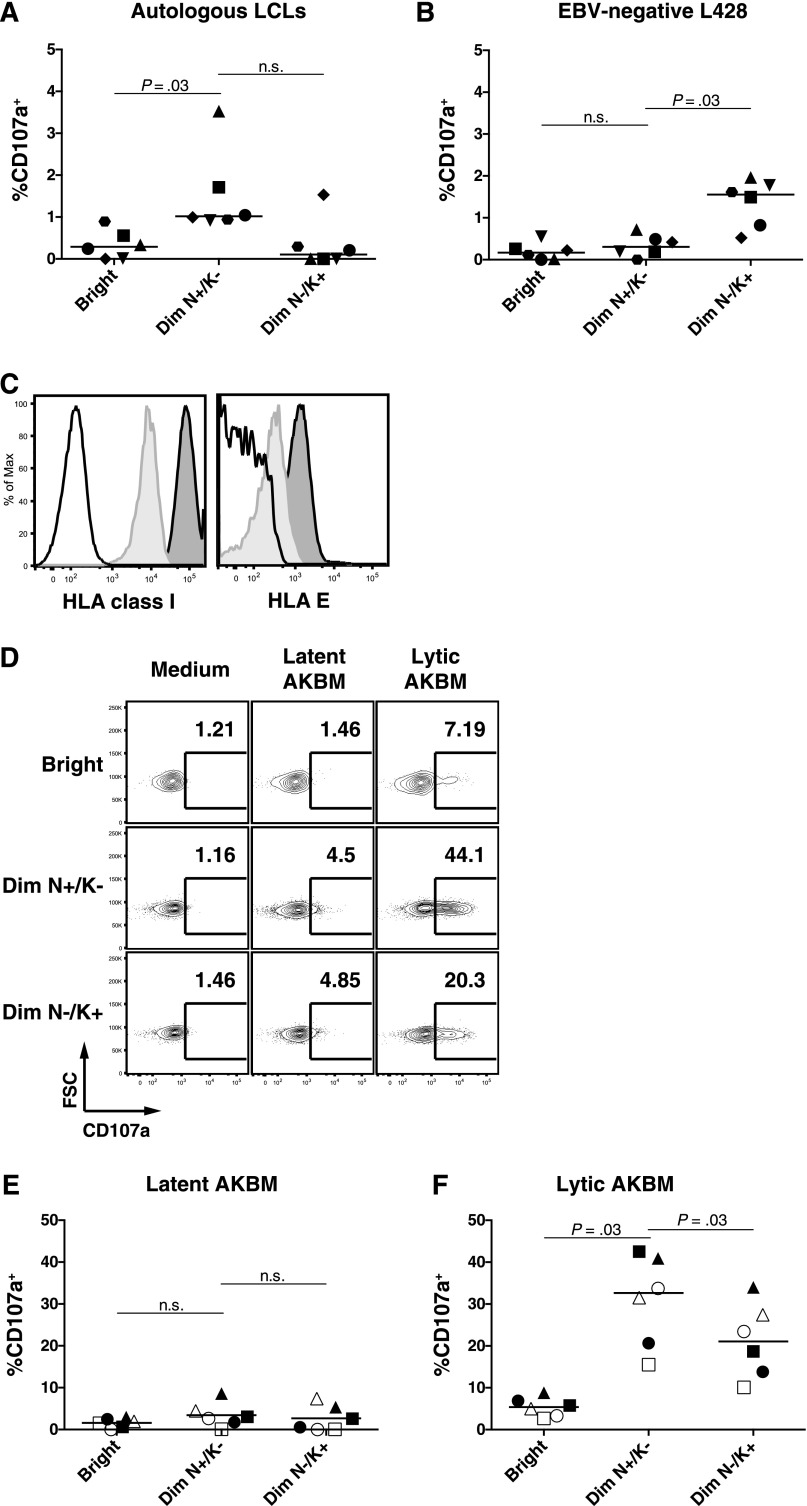
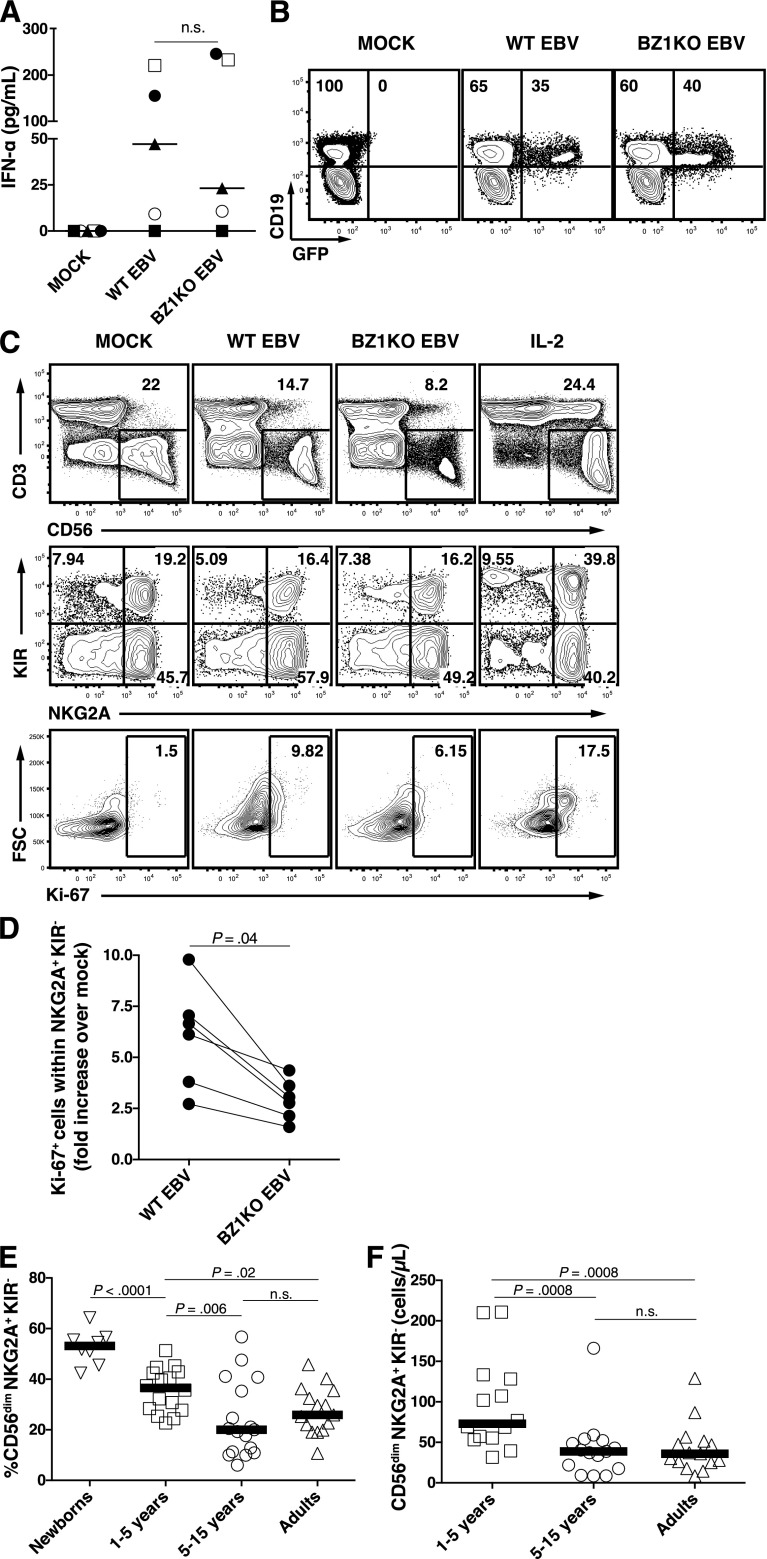
A growing body of evidence suggests that the human natural killer (NK)-cell compartment is phenotypically and functionally heterogeneous and is composed of several differentiation stages. Moreover, NK-cell subsets have been shown to exhibit adaptive immune features during herpes virus infection in experimental mice and to expand preferentially during viral infections in humans. However, both phenotype and role of NK cells during acute symptomatic Epstein-Barr virus (EBV) infection, termed infectious mononucleosis (IM), remain unclear. Here, we longitudinally assessed the kinetics, the differentiation, and the proliferation of subsets of NK cells in pediatric IM patients. Our results indicate that acute IM is characterized by the preferential proliferation of early-differentiated CD56(dim) NKG2A(+) immunoglobulin-like receptor(-) NK cells. Moreover, this NK-cell subset exhibits features of terminal differentiation and persists at higher frequency during at least the first 6 months after acute IM. Finally, we demonstrate that this NK-cell subset preferentially degranulates and proliferates on exposure to EBV-infected B cells expressing lytic antigens. Thus, early-differentiated NK cells might play a key role in the immune control of primary infection with this persistent tumor-associated virus.


Figures

Figure 1
Figure 1
Accumulation of activated HLA-DR+ CD8+ T cells and CD56dim NK cells during acute IM. PBMCs from healthy controls, IM-like patients, and IM patients at acute phase (IM acute), at 1 (IM 1 month), and 6 months (IM 6 months) were analyzed by flow cytometry. Frequencies of (A) CD8+ T cells within the CD3+ T-cell population and (B) HLA-DR+ CD8+ T cells within the CD8+ T-cell population in healthy controls (n = 19), IM-like (n = 11), and IM acute (n = 20), 1-month (n = 10) and 6-month (n = 7) patients. (C) EBV DNA load in copies per 106 PBMCs in IM-acute (n = 19), 1-month (n = 14), and 6-month (n = 9) patients. Counts (cells/µL blood) of total NK cells (D) and frequencies of CD56bright CD16, CD56dim CD16, and CD56dim CD16+ NK-cell subsets within the CD3 CD56+ NK-cell population from representative healthy control, IM-acute and 1-month patient (E). Counts (cells/µL blood) of (F) CD56bright CD16, (G) CD56dim CD16, and (H) CD56dim CD16+ NK cells in healthy controls (n = 31), IM-like patients (n = 11), and IM-acute (n = 18), 1-month (n = 10), and 6-month (n = 8) patients.
Figure 2
Figure 2
Accumulation and terminal differentiation of the CD56dim NKG2A+ KIR NK-cell subset during acute IM. PBMCs from controls and IM patients were analyzed by flow cytometry. (A) Frequencies of CD56dim NKG2A+ KIR NK cells within the CD56dim population from representative healthy control, IM-acute, 1-month, and 6-month patients. Frequencies of (B) CD56dim NKG2A+ KIR and (C) CD56dim NKG2A KIR+ NK cells in healthy EBV-negative controls (n = 17), healthy EBV-positive controls (n = 20), IM-like patients (n = 12), and IM-acute (n = 17), 1-month (n = 11), 6-month (n = 10), and 2-year (n = 4) patients. Frequencies of CD57+ cells within (D) the CD56dim NKG2A+ KIR and (E) the CD56dim NKG2A KIR+ NK-cell subsets in healthy EBV-negative controls (n = 17), healthy EBV-positive controls (n = 20), and IM-acute (n = 17), 1-month (n = 11), 6-month (n = 10), and 2-year (n = 4) patients. Horizontal lines or single symbols indicate median values. Error bars indicate interquartile ranges. Mann-Whitney U tests.
Figure 3
Figure 3
Frequencies of single KIR-positive and NKG2C+ CD56dim NK cells are not altered during acute IM. (A) Frequencies of CD56dim NKG2A NK cells expressing the 7 analyzed KIRs from 1 representative CMV-seronegative IM patient at acute phase and at 1 month. The presence of 1 KIR in a combination is represented by a color code below the graph. (B) Frequencies of single KIR-positive CD56dim NK cells in healthy controls (Ctl, n = 11) and IM patients (n = 10) at acute phase (A) and at 1 month (M1). (C) Frequencies of NKG2C+ CD57+ NK cells within the CD56dim NKG2A population from 1 CMV-seronegative and 1 CMV-seropositive IM patient at acute phase and at 1 month. (D) Frequencies of NKG2C+ NK cells within the CD56dim NKG2A NK cell population in CMV-seronegative healthy controls (n = 13), CMV-seronegative (n = 10), and CMV-seropositive (n = 5, red) IM patients at acute phase and at 1 month (n = 2 for CMV-seropositive, red lines).
Figure 4
Figure 4
Increased count of CD56dim NKG2A+ KIR CD57 NK cells during acute IM is caused by preferential proliferation. (A) Representative examples of costaining for NKG2A and Ki-67 and costaining for KIR and Ki-67 on CD56dim NK cells in healthy control and IM-acute and 1-month patients. (B) Frequencies of Ki-67+ cells within the CD56bright, CD56dim NKG2A+ KIR, and CD56dim NKG2A KIR+ NK-cell subsets in healthy controls (n = 21), in IM-acute (n = 15), and in 1-month patients (n = 7). (C) Correlation of EBV DNA loads (copies per 106 PBMCs) and frequencies of Ki-67+ cells within the CD56dim NKG2A+ KIR NK-cell subset from acute IM patients. Spearman r = 0.53, P (2-tailed) = .042. (D) Representative example of costaining for CD57 and Ki-67 on CD56dim NKG2A+ KIR NK cells in an IM-acute and 1-month patient. (E) Frequencies of Ki-67+ cells within the CD56dim NKG2A+ KIR NK cells according to CD57 expression in healthy controls (n = 15), IM-acute (n = 9), and 1-month (n = 4) patients. (F) Count of CD56dim NKG2A+ KIR CD57 in healthy EBV-negative controls (n = 14), healthy EBV-positive controls (n = 17), IM-like (n = 11), IM-acute (n = 17), 1-month (n = 10), and 6-month (n = 8) patients. Horizontal lines indicate median values of a given symbol. Mann-Whitney U tests.
Figure 5
Figure 5
Increased cytotoxic degranulation of the CD56dim NKG2A+ KIR NK subset against EBV-infected B cells with lytic replication. (A) PBMCs from 6 healthy EBV-positive donors were cocultured with autologous LCLs and (B) EBV-negative L428 at an effector to target ratio of 10:1 for 6 hours. Frequencies of degranulating (CD107a+) cells within the CD56bright (Bright), the CD56dim NKG2A+ KIR (Dim N+/K−), and the CD56dim NKG2A KIR+ (Dim N−/K+) NK-cell subsets were assessed by flow cytometry at the end of the coculture. (C) HLA class I and HLA-E expression on CD19+ B cells from PBMCs (light gray histogram) and from autologous LCLs (dark gray histogram). Isotype controls are depicted as a white histogram. (D) Representative example of frequencies of CD107a+ NK cells within the 3 NK-cell subsets after coculture with latent AKBM or lytic AKBM. Frequencies of degranulating (CD107a+) NK cells within the CD56bright (Bright), the CD56dim NKG2A+ KIR (Dim N+/K−) and the CD56dim NKG2A matched KIR+ (Dim N−/K+) NK-cell subsets in PBMCs from 3 convalescent IM patients (open symbols) and 3 healthy EBV-positive donors (filled symbols) cocultured with (E) latent AKBM or (F) lytic AKBM (n = 6). Horizontal lines indicate median values of a given subset, Wilcoxon matched-pairs signed ranks tests.
Figure 6
Figure 6
EBV-driven in vitro proliferation of NKG2A+ KIR- NK cells partially depends on expression of lytic antigens. Proliferation of NK-cell subsets was assessed 7 days after inoculation of CBMCs with either WT EBV, BZLF1-KO (BZ1KO) EBV or PBS (MOCK). (A) Concentrations of IFN-α in supernatant 24-hour postinoculation on MOCK, WT EBV, and BZ1KO EBV infection (pg/mL; n = 5). (B) Representative example of CD19 and GFP costaining within live lymphocytes 72 hours postinfection. Numbers indicate frequencies of GFP-negative or GFP-positive cells within the CD19+ B-cell population. (C) Frequencies of Ki-67+ NKG2A+ KIR NK cells 7 days after inoculation of CBMCs with mock, WT EBV, or BZ1KO EBV, or after stimulation with IL-2. The depicted gates were assessed within live lymphocytes (first row), CD3 CD56+ NK cells (second row), and NKG2A+ KIR NK cells (third row). (D) Ratio of NKG2A+ KIR Ki-67+ NK-cell counts from WT EBV- or BZ1KO EBV- over mock-infected CBMCs. (E) Frequencies of CD56dim NKG2A+ KIR NK cells in newborns (n = 8), children aged 1 to 5 years (n = 16), children aged 5 to 15 years (n = 17), and adults aged 20 to 30 years (n = 15). (F) Counts of CD56dim NKG2A+ KIR- NK cells in children aged 1 to 5 years (n = 14), children aged 5 to 15 years (n = 15), and adults aged 20 to 30 years (n = 15). Horizontal lines indicate median values of a given age group, Mann-Whitney U tests.

References

    1. Lanier LL. Evolutionary struggles between NK cells and viruses. Nat Rev Immunol. 2008;8(4):259–268. - PMC - PubMed
    1. Sun JC, Beilke JN, Lanier LL. Adaptive immune features of natural killer cells. Nature. 2009;457(7229):557–561. - PMC - PubMed
    1. Björkström NK, Riese P, Heuts F, et al. Expression patterns of NKG2A, KIR, and CD57 define a process of CD56dim NK-cell differentiation uncoupled from NK-cell education. Blood. 2010;116(19):3853–3864. - PubMed
    1. Béziat V, Descours B, Parizot C, Debré P, Vieillard V. NK cell terminal differentiation: correlated stepwise decrease of NKG2A and acquisition of KIRs. PLoS ONE. 2010;5(8):e11966. - PMC - PubMed
    1. Orange JS. Natural killer cell deficiency. J Allergy Clin Immunol. 2013;132(3):515–525, quiz 526. - PMC - PubMed

Publication types

MeSH terms