. 2014 Dec;13(12):3435-45.
doi: 10.1074/mcp.M114.038513. Epub 2014 Sep 9.

Copy number analysis of the murine platelet proteome spanning the complete abundance range

Affiliations

Copy number analysis of the murine platelet proteome spanning the complete abundance range

Marlis Zeiler et al. Mol Cell Proteomics. 2014 Dec.

Abstract

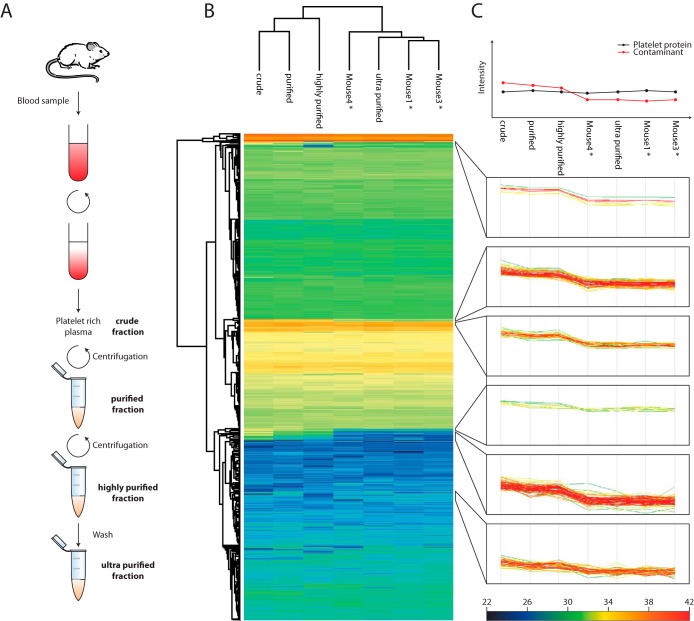
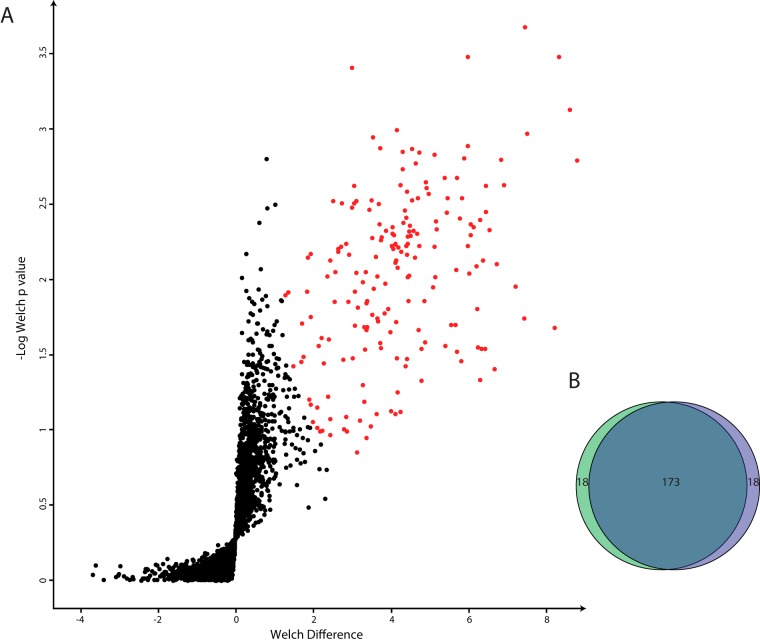
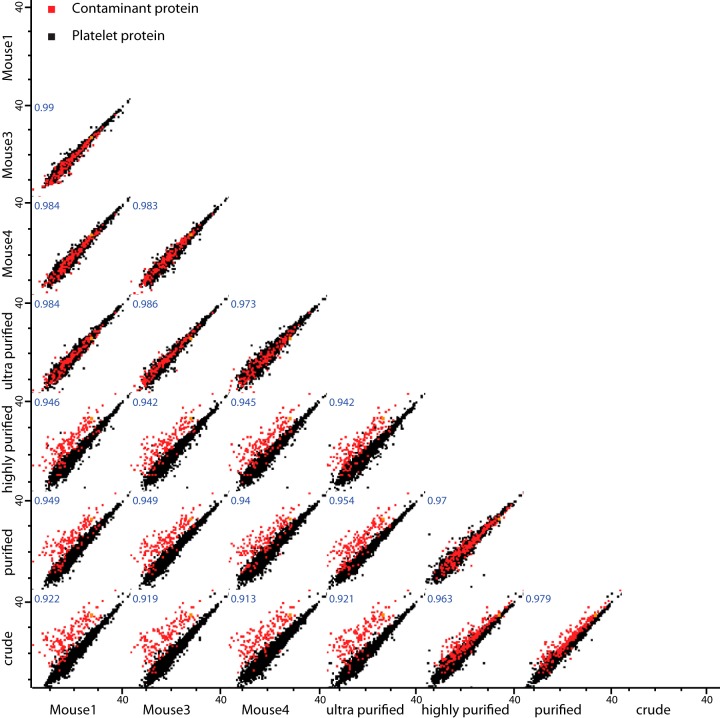
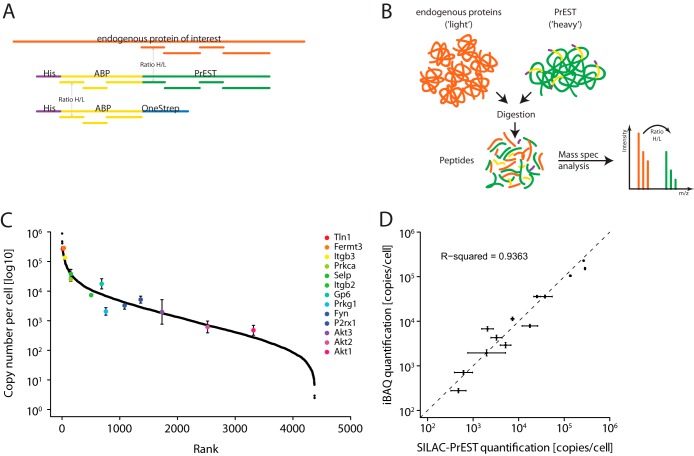
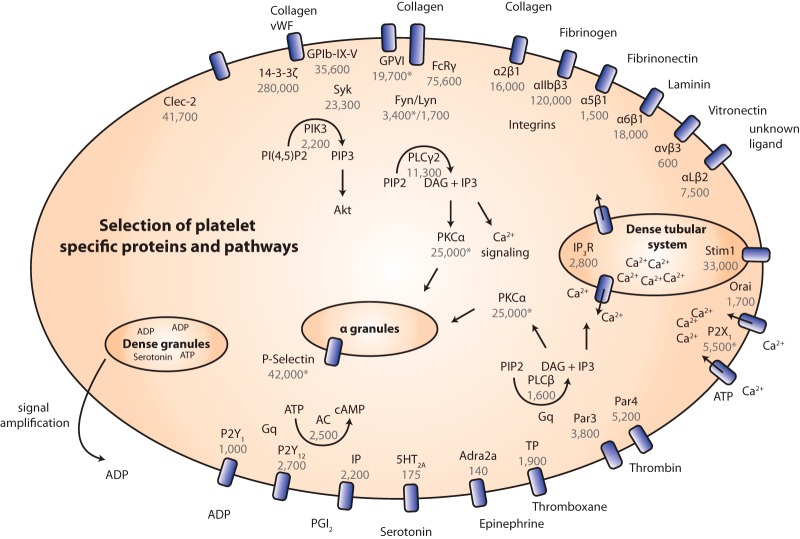
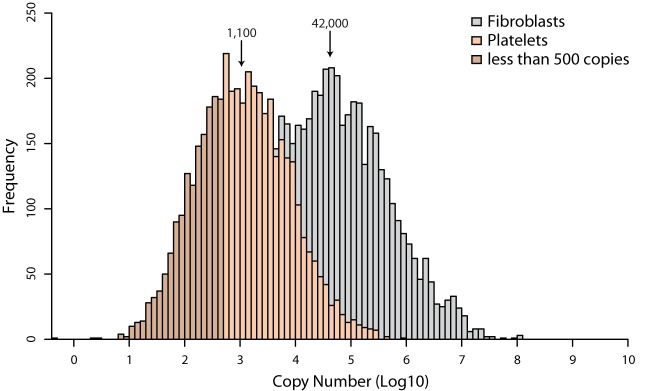
Knowledge of the identity and quantity of expressed proteins of a cell type is a prerequisite for a complete understanding of its molecular functions. Mass-spectrometry-based proteomics has allowed the identification of the entire protein complement of yeast and the close-to-complete set of proteins expressed in mammalian cell lines. Using recent technological advances, we here characterized the proteome of murine platelets, key actors in mediating hemostasis and thrombosis. We accurately measured the absolute protein concentrations of 13 platelet proteins using SILAC-protein epitope signature tags and used them as reference points to estimate the copy numbers of all proteins of the platelet proteome. To distinguish contaminants such as plasma or erythrocyte proteins from true platelet proteins, we monitored protein abundance profiles across multiple purification steps. In total, we absolutely quantified 4,400 platelet proteins, with estimated copy numbers ranging from less than 10 to about a million per cell. Stoichiometries derived from our data correspond well with previous studies. Our study provides a close-to-complete reference map of platelet proteins that will be useful to the community, for instance, for interpreting mouse models of human platelet diseases.


Figures

Fig. 1.
Fig. 1.
Platelet preparation and protein correlation profiling. A, the platelet preparation workflow. Platelets were purified via the depicted centrifugation and washing steps. For the protein correlation profiling, several mice were pooled, and at each purification step a sample was taken. For the mouse samples only at the ultra-purified fraction a sample was collected (*ultra-purified). B, unsupervised hierarchical clustering of protein abundance profiles of the different stages of purity. C, prototypical abundance profile of contaminating proteins (upper panel) and actual profiles of contaminating proteins at every abundance level.
Fig. 2.
Fig. 2.
Identification of the contaminations via Welch's t test. A, volcano plot of one-sided Welch's t test; statistically significant (false discovery rate of 0.05) hits are marked in red. B, Venn diagram depicting the overlap between hierarchical clustering and Welch's t test.
Fig. 3.
Fig. 3.
Reproducibility of the proteomic measurements. Scatter plot of the proteins comparing replicates showing reproducibility as indicated by the Pearson correlation coefficients. Contaminant proteins are offset in the semi-purified samples because they are progressively de-enriched.
Fig. 4.
Fig. 4.
Absolute protein quantification. A, quantification of the PrEST. Highly purified ABPs are quantified by means of amino acid analysis. The concentration of the SILAC-labeled PrESTs is determined using the common ABP-derived tryptic peptides. B, in a separate experiment, previously quantified PrESTs are multiplexed and spiked into the platelet lysate. The sample is processed via filter-aided sample preparation (FASP), and the concentration of the endogenous proteins is read out using the SILAC ratio determined in the mass spectrometer. C, 13 different PrESTs were used to quantify proteins of interest over the whole abundance range. D, comparison of protein copy numbers of 13 selected proteins obtained using SILAC-PrEST to those calculated using the iBAQ method.
Fig. 5.
Fig. 5.
Selection of platelet-specific proteins and pathways. Overview of major adhesion and signaling receptors of platelets, as well as downstream signaling pathways. Copy numbers derived in this study are depicted in gray (copy numbers with an asterisk were measured with SILAC-PrEST quantification).
Fig. 6.
Fig. 6.
Histogram of all copy numbers. Comparison between the protein abundance distributions of fibroblast and platelet copy numbers. Proteins below 500 are depicted in dark brown.

References

    1. Michelson A. D. (2010) Antiplatelet therapies for the treatment of cardiovascular disease. Nat. Rev. Drug Discov. 9, 154–169 - PubMed
    1. Weyrich A. S., Schwertz H., Kraiss L. W., Zimmerman G. A. (2009) Protein synthesis by platelets: historical and new perspectives. J. Thrombosis Haemostasis 7, 241–246 - PMC - PubMed
    1. McRedmond J. P., Park S. D., Reilly D. F., Coppinger J. A., Maguire P. B., Shields D. C., Fitzgerald D. J. (2004) Integration of proteomics and genomics in platelets: a profile of platelet proteins and platelet-specific genes. Mol. Cell. Proteomics 3, 133–144 - PubMed
    1. Rowley J. W., Oler A. J., Tolley N. D., Hunter B. N., Low E. N., Nix D. A., Yost C. C., Zimmerman G. A., Weyrich A. S. (2011) Genome-wide RNA-seq analysis of human and mouse platelet transcriptomes. Blood 118, e101–e111 - PMC - PubMed
    1. Zufferey A., Fontana P., Reny J. L., Nolli S., Sanchez J. C. (2012) Platelet proteomics. Mass Spectrom. Rev. 31, 331–351 - PubMed

Publication types