

Coding of stimulus strength via analog calcium signals in Purkinje cell dendrites of awake mice
- PMID: 25205669
- PMCID: PMC4158287
- DOI: 10.7554/eLife.03663
Coding of stimulus strength via analog calcium signals in Purkinje cell dendrites of awake mice
Abstract
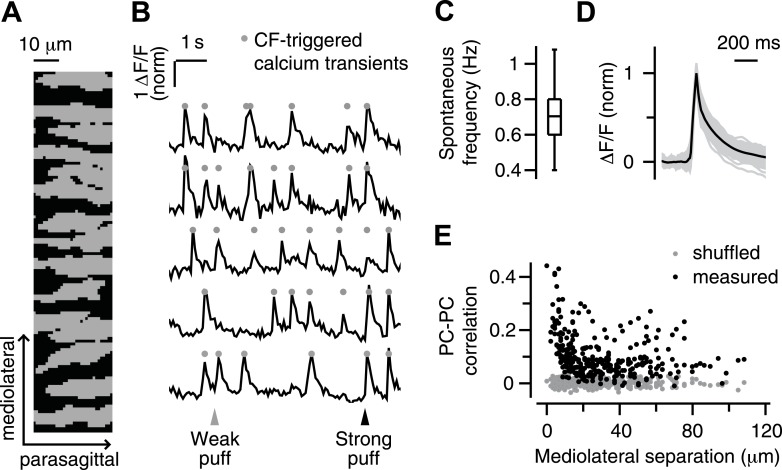
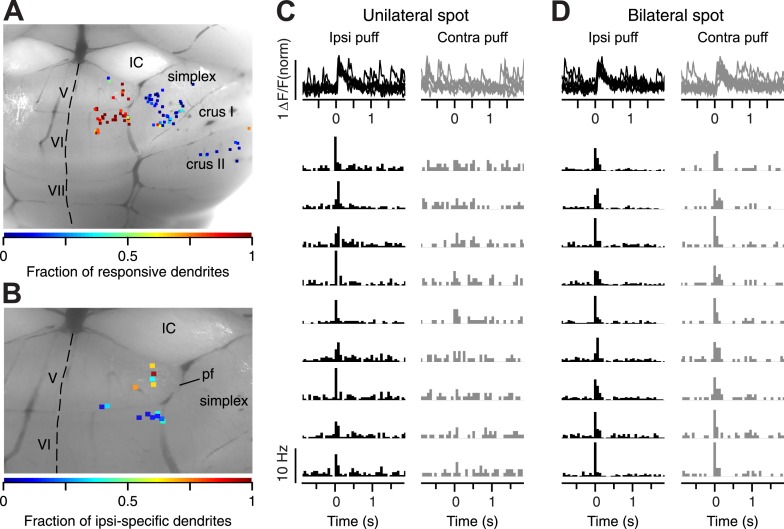
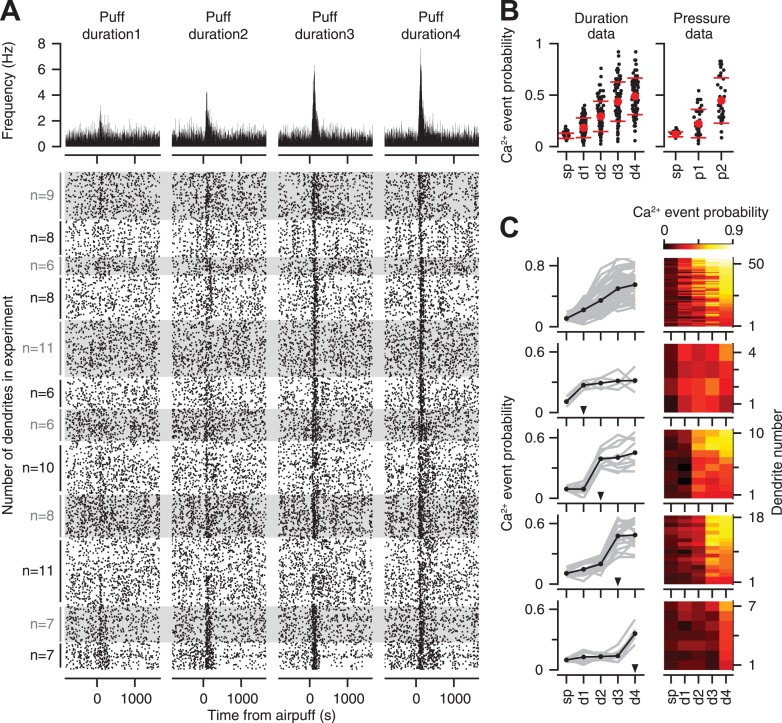
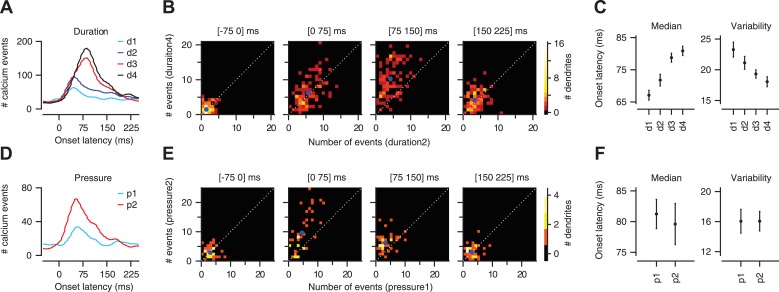
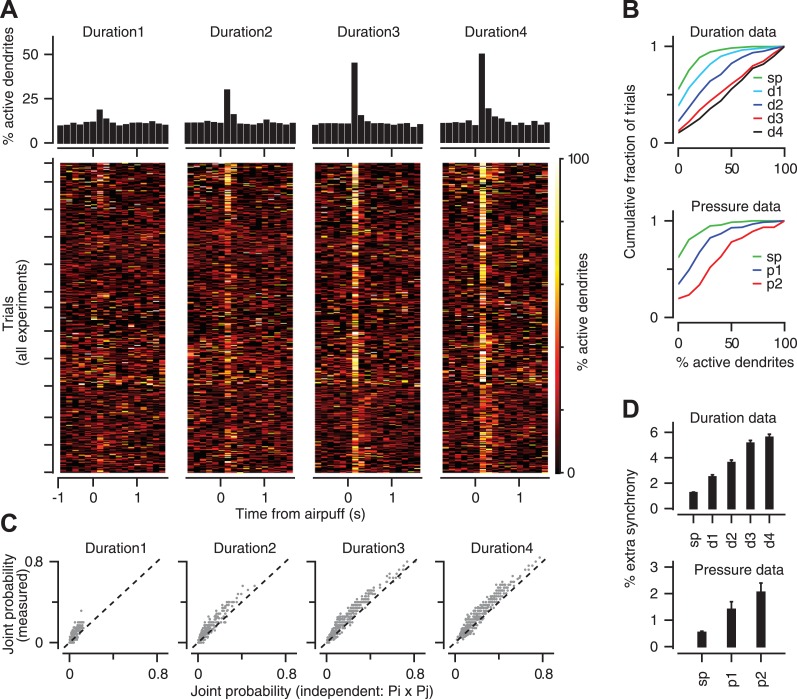
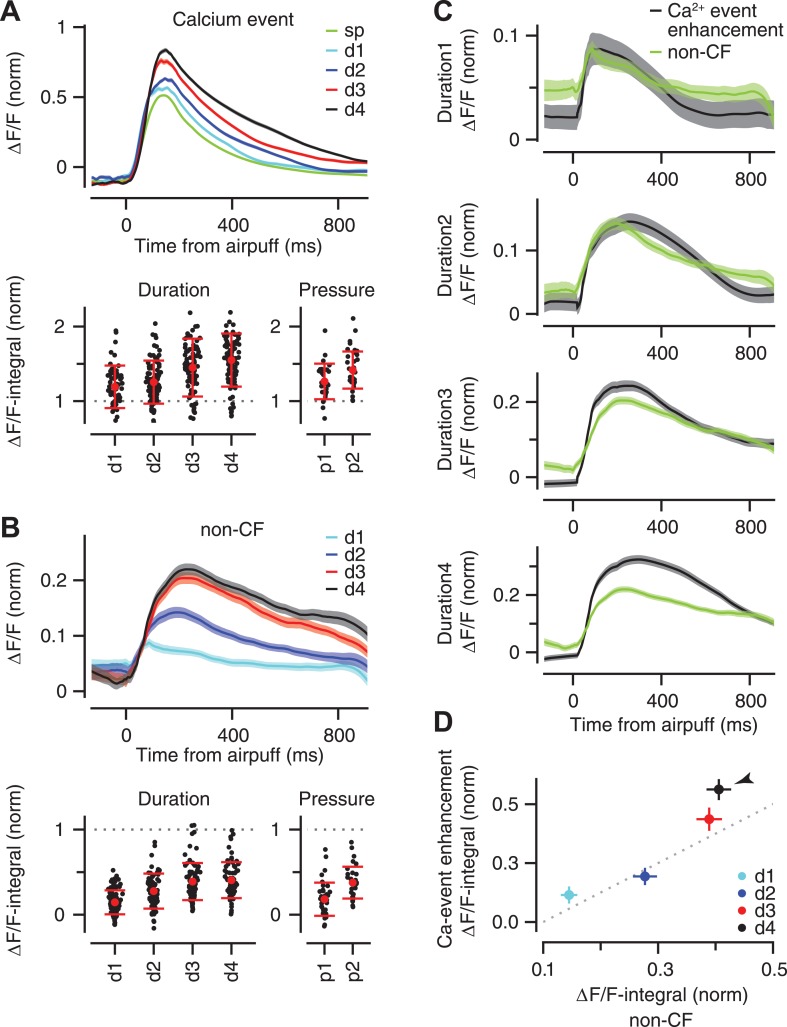
The climbing fiber input to Purkinje cells acts as a teaching signal by triggering a massive influx of dendritic calcium that marks the occurrence of instructive stimuli during cerebellar learning. Here, we challenge the view that these calcium spikes are all-or-none and only signal whether the instructive stimulus has occurred, without providing parametric information about its features. We imaged ensembles of Purkinje cell dendrites in awake mice and measured their calcium responses to periocular airpuffs that serve as instructive stimuli during cerebellar-dependent eyeblink conditioning. Information about airpuff duration and pressure was encoded probabilistically across repeated trials, and in two additional signals in single trials: the synchrony of calcium spikes in the Purkinje cell population, and the amplitude of the calcium spikes, which was modulated by a non-climbing fiber pathway. These results indicate that calcium-based teaching signals in Purkinje cells contain analog information that encodes the strength of instructive stimuli trial-by-trial.
Keywords: cerebellum; climbing fiber; motor learning; neural coding; plasticity; unconditioned stimulus.
Copyright © 2014, Najafi et al.
Conflict of interest statement
The authors declare that no competing interests exist.
Figures
Similar articles
-
Spatial pattern coding of sensory information by climbing fiber-evoked calcium signals in networks of neighboring cerebellar Purkinje cells.J Neurosci. 2009 Jun 24;29(25):8005-15. doi: 10.1523/JNEUROSCI.4919-08.2009. J Neurosci. 2009. PMID: 19553440 Free PMC article.
-
Reliable coding emerges from coactivation of climbing fibers in microbands of cerebellar Purkinje neurons.J Neurosci. 2009 Aug 26;29(34):10463-73. doi: 10.1523/JNEUROSCI.0967-09.2009. J Neurosci. 2009. PMID: 19710300 Free PMC article.
-
Climbing fibers encode a temporal-difference prediction error during cerebellar learning in mice.Nat Neurosci. 2015 Dec;18(12):1798-803. doi: 10.1038/nn.4167. Epub 2015 Nov 9. Nat Neurosci. 2015. PMID: 26551541 Free PMC article.
-
Dendritic calcium signaling in cerebellar Purkinje cell.Neural Netw. 2013 Nov;47:11-7. doi: 10.1016/j.neunet.2012.08.001. Epub 2012 Sep 5. Neural Netw. 2013. PMID: 22985934 Review.
-
Functional significance of climbing-fiber synchrony: a population coding and behavioral analysis.Ann N Y Acad Sci. 2002 Dec;978:188-204. doi: 10.1111/j.1749-6632.2002.tb07567.x. Ann N Y Acad Sci. 2002. PMID: 12582053 Review.
Cited by
-
Bidirectional short-term plasticity during single-trial learning of cerebellar-driven eyelid movements in mice.Neurobiol Learn Mem. 2020 Apr;170:107097. doi: 10.1016/j.nlm.2019.107097. Epub 2019 Oct 11. Neurobiol Learn Mem. 2020. PMID: 31610225 Free PMC article.
-
Control of action potential afterdepolarizations in the inferior olive by inactivating A-type currents through KV4 channels.J Physiol. 2024 Sep 20:10.1113/JP286818. doi: 10.1113/JP286818. Online ahead of print. J Physiol. 2024. PMID: 39303148
-
Designing AAV Vectors for Monitoring the Subtle Calcium Fluctuations of Inferior Olive Network in vivo.Front Cell Neurosci. 2022 Apr 27;16:825056. doi: 10.3389/fncel.2022.825056. eCollection 2022. Front Cell Neurosci. 2022. PMID: 35573836 Free PMC article.
-
Conversion of Graded Presynaptic Climbing Fiber Activity into Graded Postsynaptic Ca2+ Signals by Purkinje Cell Dendrites.Neuron. 2019 May 22;102(4):762-769.e4. doi: 10.1016/j.neuron.2019.03.010. Epub 2019 Mar 27. Neuron. 2019. PMID: 30928170 Free PMC article.
-
Parvalbumin-expressing basal forebrain neurons mediate learning from negative experience.Nat Commun. 2024 Jun 7;15(1):4768. doi: 10.1038/s41467-024-48755-7. Nat Commun. 2024. PMID: 38849336 Free PMC article.
References
-
- Bell CC, Kawasaki T. 1972. Relations among climbing fiber responses of nearby Purkinje Cells. Journal of Neurophysiology 35:155–169 - PubMed
Publication types
MeSH terms
Substances
Grants and funding
LinkOut - more resources
Full Text Sources
Other Literature Sources
