

Correlation between X-ray cross-complementing group 1 polymorphisms and the onset risk of glioma: A meta-analysis
- PMID: 25206557
- PMCID: PMC4146115
- DOI: 10.3969/j.issn.1673-5374.2013.26.008
Correlation between X-ray cross-complementing group 1 polymorphisms and the onset risk of glioma: A meta-analysis
Abstract
Objective: To evaluate the association of X-ray cross-complementing group 1 (XRCC1) Arg399Gln, Arg194Trp and Arg280His polymorphisms with the risk of glioma.
Data sources: A systematic literature search of papers published from January 2000 to August 2012 in PubMed, Embase, China National Knowledge Infrastructure database, and Wanfang database was performed. The key words used were "glioma", "polymorphism", and "XRCC1 or X-ray repair cross-complementing group 1". References cited in the retrieved articles were screened manually to identify additional eligible studies.
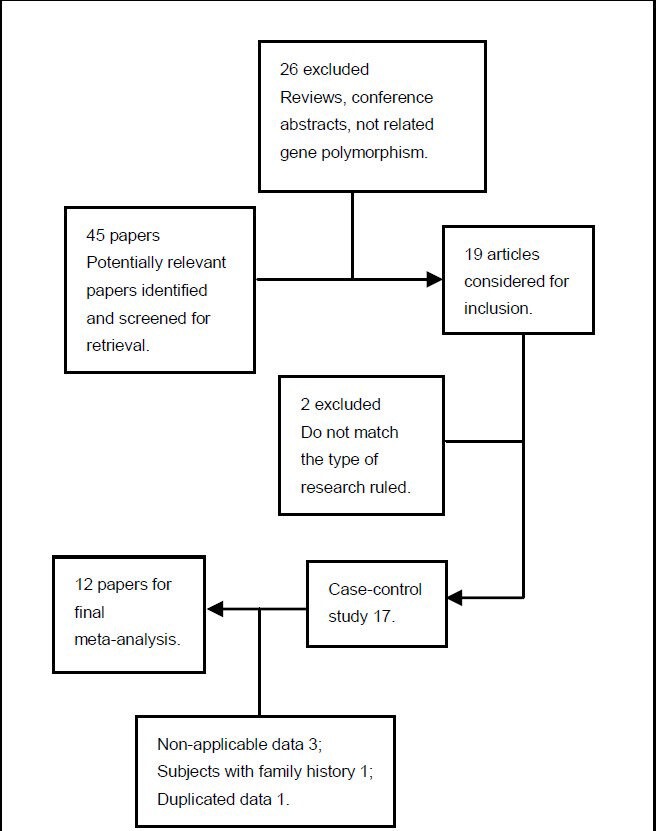
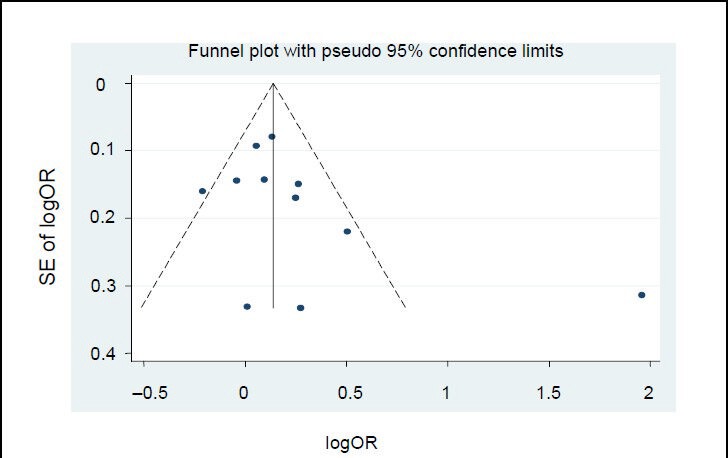
Study selection: STUDIES WERE IDENTIFIED ACCORDING TO THE FOLLOWING INCLUSION CRITERIA: case-control design was based on unrelated individuals; and genotype frequency was available to estimate an odds ratio (OR) and 95% confidence interval (CI). Meta-analysis was performed for the selected studies after strict screening. Dominant and recessive genetic models were used and the relationship between homozygous mutant genotype frequencies and mutant gene frequency and glioma incidence was investigated. We chose the fixed or random effect model according to the heterogeneity to calculate OR and 95%CI, and sensitivity analyses were conducted. Publication bias was examined using the inverted funnel plot and the Egger's test using Stata 12.0 software.
Main outcome measures: Association of XRCC1 Arg399Gln, Arg194Trp, and Arg280His polymorphisms with the risk of glioma, and subgroup analyses were performed according to different ethnicities of the subjects.
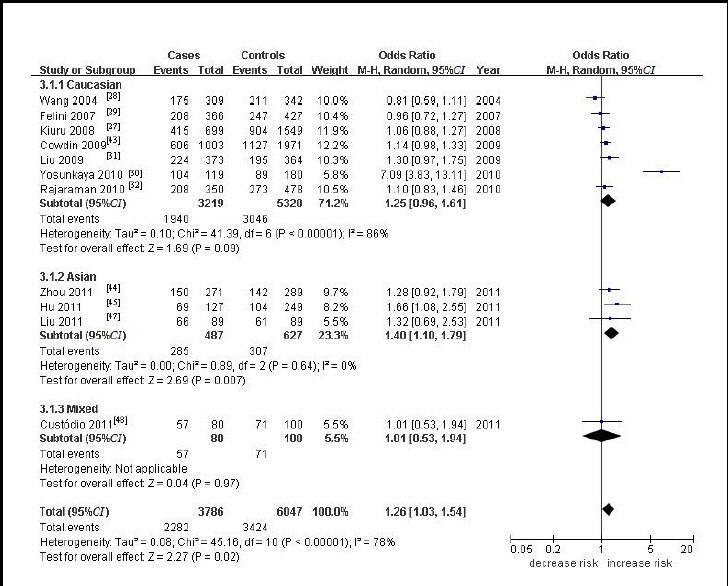
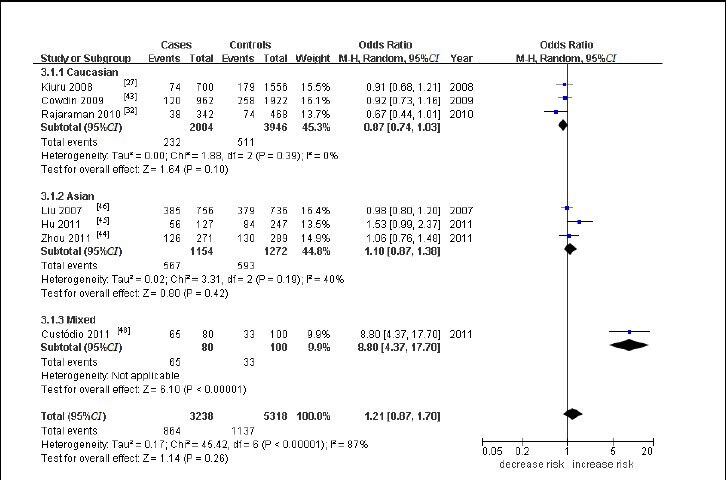
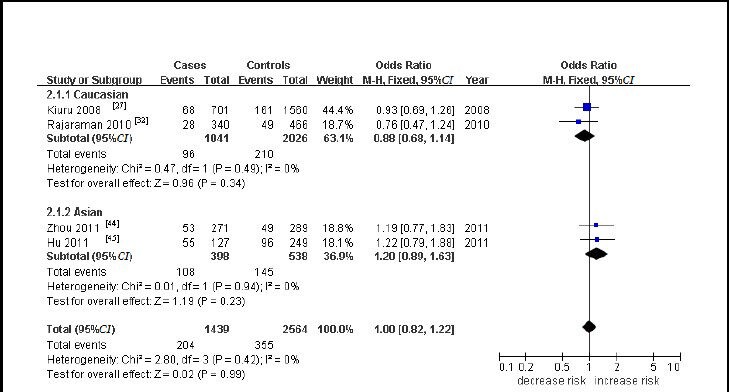
Results: Twelve articles were included in the meta-analysis. Eleven of the articles were concerned with the Arg399Gln polymorphism and glioma onset risk. Significantly increased glioma risks were found only in the dominant model (Gln/Gln + Gln/Arg versus Arg/Arg: OR = 1.26, 95%CI = 1.03-1.54, P = 0.02). In the subgroup analysis by ethnicity, significantly increased risk was found in Asian subjects in the recessive (OR = 1.46, 95%CI = 1.04-2.45, P = 0.03) and dominant models (OR = 1.40, 95%CI = 1.10-1.78, P = 0.007), and homozygote contrast (OR = 1.69, 95%CI = 1.17-2.45, P = 0.005), but not in Caucasian subjects. For association of the Arg194Trp (eight studies) and Arg280His (four studies) polymorphisms with glioma risk, the meta-analysis did not reveal a significant effect in the allele contrast, the recessive genetic model, the dominant genetic model, or homozygote contrast.
Conclusion: The XRCC1 Arg399Gln polymorphism may be a biomarker of glioma susceptibility, especially in Asian populations. The Arg194Trp and Arg280His polymorphisms were not associated with overall glioma risk.
Keywords: X-ray cross-complementing group 1; gene mutation; gene polymorphism; glioma; grants-supported paper; meta-analysis; neural regeneration; neuroregeneration; onset risk; susceptibility.
Conflict of interest statement
Figures
Similar articles
-
Association between the XRCC1 polymorphisms and glioma risk: a meta-analysis of case-control studies.PLoS One. 2013;8(1):e55597. doi: 10.1371/journal.pone.0055597. Epub 2013 Jan 30. PLoS One. 2013. PMID: 23383237 Free PMC article.
-
X-ray repair cross-complementing gene 1 Arg399Gln polymorphism and glioma risk among Asians: A meta-analysis based on 2 326 cases and 3 610 controls.Neural Regen Res. 2012 Oct 15;7(29):2313-9. doi: 10.3969/j.issn.1673-5374.2012.29.011. Neural Regen Res. 2012. PMID: 25538755 Free PMC article.
-
X-ray repair cross-complementing group 1 polymorphisms and hepatocellular carcinoma: a meta-analysis.World J Gastroenterol. 2012 Aug 21;18(31):4207-14. doi: 10.3748/wjg.v18.i31.4207. World J Gastroenterol. 2012. PMID: 22919255 Free PMC article. Review.
-
XRCC1 gene polymorphisms and glioma risk in Chinese population: a meta-analysis.PLoS One. 2014 Nov 6;9(11):e111981. doi: 10.1371/journal.pone.0111981. eCollection 2014. PLoS One. 2014. PMID: 25375625 Free PMC article.
-
Association between X-ray repair cross-complementing group 1 gene polymorphisms and glioma risk: a systematic review and meta-analysis based on 22 case-control studies.Int J Clin Exp Med. 2015 Aug 15;8(8):11863-80. eCollection 2015. Int J Clin Exp Med. 2015. PMID: 26550099 Free PMC article. Review.
Cited by
-
Reappraisal of XRCC1 Arg194Trp polymorphism and glioma risk: a cumulative meta-analysis.Oncotarget. 2017 Mar 28;8(13):21599-21608. doi: 10.18632/oncotarget.15376. Oncotarget. 2017. PMID: 28423490 Free PMC article.
References
-
- Habberstad AH, Lind-Landström T, Sundstrøm S, et al. Primary human glioblastomas - prognostic value of clinical and histopathological parameters. Clin Neuropathol. 2012;31(5):361–368. - PubMed
-
- Schwartzbaum JA, Fisher JL, Aldape KD, et al. Epidemiology and molecular pathology of glioma. Nat Clin Pract Neurol. 2006;2(9):494–503. 516. - PubMed
-
- Osborne RH, Houben MP, Tijssen CC, et al. The genetic epidemiology of glioma. Neurology. 2001;57(10):1751–1755. - PubMed
-
- Ohgaki H, Kleihues P. Epidemiology and etiology of gliomas. Acta Neuropathol. 2005;109(1):93–108. - PubMed
LinkOut - more resources
Full Text Sources