. 2014 Jul 8;15(4):4831.
doi: 10.1120/jacmp.v15i4.4831.

Design and production of 3D printed bolus for electron radiation therapy

Affiliations

Design and production of 3D printed bolus for electron radiation therapy

Shiqin Su et al. J Appl Clin Med Phys. .

Abstract

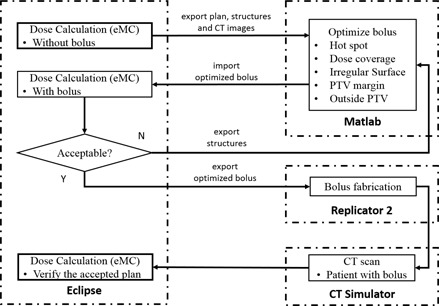
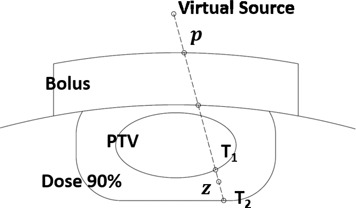
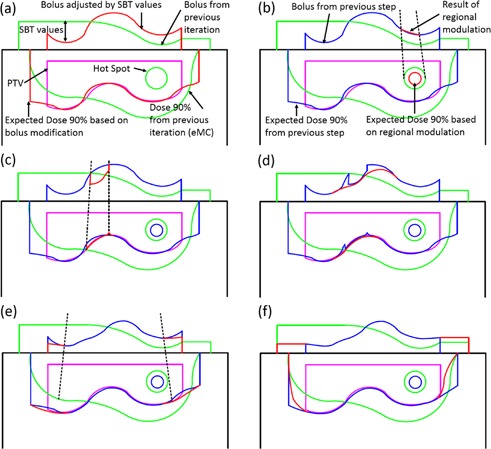
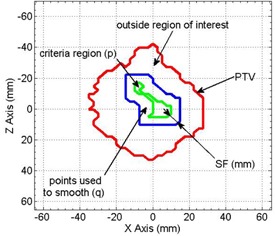
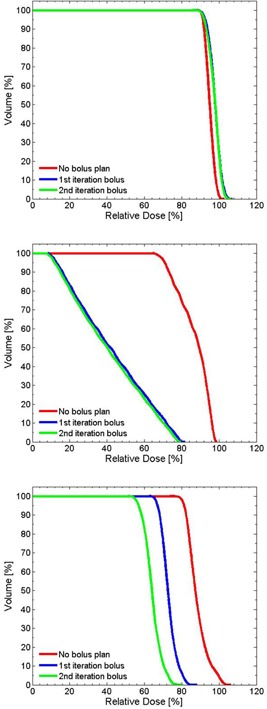
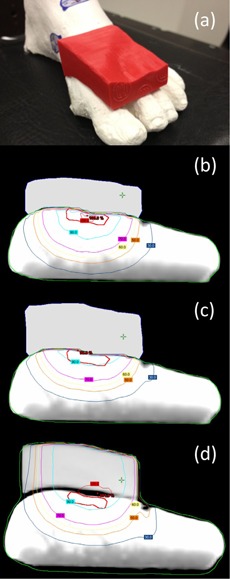
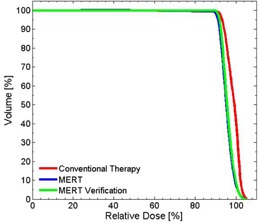
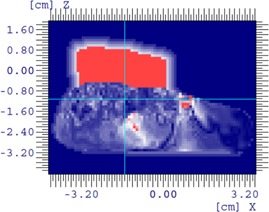
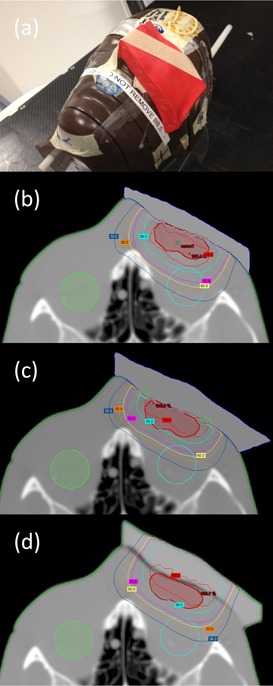
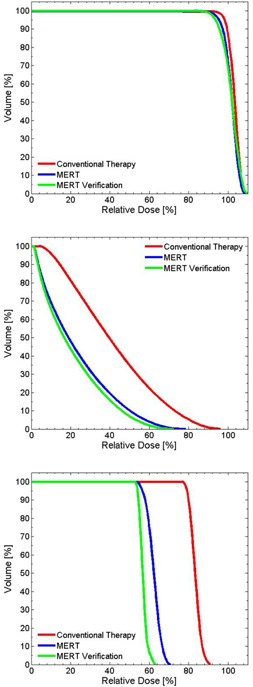
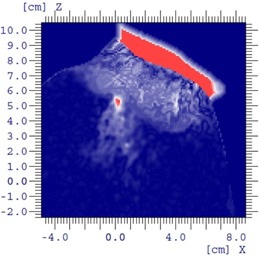
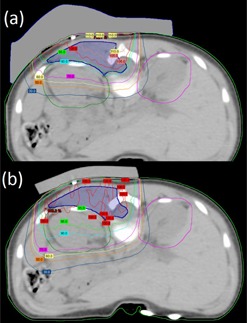
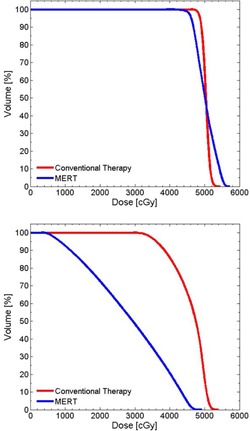
This is a proof-of-concept study demonstrating the capacity for modulated electron radiation therapy (MERT) dose distributions using 3D printed bolus. Previous reports have involved bolus design using an electron pencil beam model and fabrication using a milling machine. In this study, an in-house algorithm is presented that optimizes the dose distribution with regard to dose coverage, conformity, and homogeneity within the planning target volume (PTV). The algorithm takes advantage of a commercial electron Monte Carlo dose calculation and uses the calculated result as input. Distances along ray lines from the distal side of 90% isodose line to distal surface of the PTV are used to estimate the bolus thickness. Inhomogeneities within the calculation volume are accounted for using the coefficient of equivalent thickness method. Several regional modulation operators are applied to improve the dose coverage and uniformity. The process is iterated (usually twice) until an acceptable MERT plan is realized, and the final bolus is printed using solid polylactic acid. The method is evaluated with regular geometric phantoms, anthropomorphic phantoms, and a clinical rhabdomyosarcoma pediatric case. In all cases the dose conformity are improved compared to that with uniform bolus. For geometric phantoms with air or bone inhomogeneities, the dose homogeneity is markedly improved. The actual printed boluses conform well to the surface of complex anthropomorphic phantoms. The correspondence of the dose distribution between the calculated synthetic bolus and the actual manufactured bolus is shown. For the rhabdomyosarcoma patient, the MERT plan yields a reduction of mean dose by 38.2% in left kidney relative to uniform bolus. MERT using 3D printed bolus appears to be a practical, low-cost approach to generating optimized bolus for electron therapy. The method is effective in improving conformity of the prescription isodose surface and in sparing immediately adjacent normal tissues.


Figures

Figure 1
Figure 1
Bolus design workflow.
Figure 2
Figure 2
Real distance T1T2 along each ray line.
Figure 3
Figure 3
Schematic representation of bolus design algorithm after first iteration. The green lines indicate the previous iteration's bolus and corresponding 90% isodose line which does not yet conform well to the PTV (magenta) in this example. The red lines show the bolus shape modified by the current step (a‐f) (i.e., change in thickness by SBT value or a regional modulation operator), as well as the effect of this change on the dose distribution. For reference, blue lines denote the bolus shape and 90% isodose line from the previous step. Hot spots are indicated as circles. The individual steps are: (a) estimation of the bolus thickness based on SBT values, (b) smoothing for hot spots, (c) smoothing for dose coverage, (d) smoothing for surface irregularity, (e) adjustment at PTV margin and (f) extension outside PTV.
Figure 4
Figure 4
Schematic representation of regions involved in smoothing (e.g., to alleviate a hot spot). The red line shows the projection of the PTV onto the calculation plane. The green line denotes the region of interest satisfying the hot spot criterion and containing points, p, that will be adjusted. Points q between the blue and green lines are included in the smoothing operation, but are not adjusted.
Figure 5
Figure 5
Diagram representation of Eq. (3) using sigma=10 when SBTp before the adjustment is assigned to 1 (left) and 1 (right).
Figure 6
Figure 6
Measured shift zeffzreal of PDD curves for a 12 MeV electron beam incident on a Solid Water phantom for 0, 1, 2, and 3 cm thicknesses of solid water replaced by PLA slabs (left). CET value of PLA vs. incident energy of 6, 9, 12, and 16 MeV (right).
Figure 7
Figure 7
PDD curves for 12 MeV electron beam with 2 cm solid water replaced by PLA slabs.
Figure 8
Figure 8
Wedge‐shaped PTV case (a) where a 20×20×20cm3 water phantom was irradiated by 12 MeV with no bolus; following (b) one and (c) two iterations of bolus optimization.
Figure 9
Figure 9
Cumulative DVH for the wedge PTV (top), bone slab (middle), and air cavity (bottom).
Figure 10
Figure 10
Picture of foot phantom (a) with bolus added on the surface. Isodose plot of (b) conventional plan using 1 cm bolus, (c) MERT plan using optimized bolus, and (d) MERT verification plan using bolus printed by the standard print profiles.
Figure 11
Figure 11
Cumulative DVH for PTV in the foot phantom using planned bolus and fabricated bolus.
Figure 12
Figure 12
Gamma comparison of MERT using planned bolus and fabricated bolus for foot phantom.
Figure 13
Figure 13
Picture of head phantom (a) with bolus added on the surface. Isodose plot of (b) conventional plan using flat bolus, (c) MERT plan using optimized bolus, and (d) MERT verification plan using bolus printed by the standard print profiles.
Figure 14
Figure 14
Cumulative DVH for PTV (top), left eye (middle), and left lens (bottom) for head phantom case.
Figure 15
Figure 15
Gamma comparison of MERT using planned bolus and fabricated bolus for head phantom.
Figure 16
Figure 16
Rhabdomyosarcoma patient (a) using MERT with the algorithm applied for three times; (b) conventional therapy with 1 cm custom bolus.
Figure 17
Figure 17
Cumulative DVH for PTV (top) and left kidney (bottom) for rhabdomyosarcoma patient.

References

    1. Hyödynmaa S, Gustafsson A, Brahme A. Optimization of conformal electron beam therapy using energy‐ and fluence‐modulated beams. Med Phys. 1996;23(5):659–66. - PubMed
    1. Klein EE. Modulated electron beams using multi‐segmented multileaf collimation. Radiother Oncol. 1998;48(3):307–11. - PubMed
    1. Ma CM, Pawlicki T, Lee MC, et al. Energy‐ and intensity‐modulated electron beams for radiotherapy. Phys Med Biol. 2000;45(8):2293–311. - PubMed
    1. Klein EE, Vicic M, Ma CM, Low DA, Drzymala RE. Validation of calculations for electrons modulated with conventional photon multileaf collimators. Phys Med Biol. 2008;53(5):1183–208. - PubMed
    1. Klein EE, Mamalui‐Hunter M, Low DA. Delivery of modulated electron beams with conventional photon multileaf collimators. Phys Med Biol. 2009;54(2):327–39. - PubMed

Publication types